LTV (customer lifetime value)
LTV (customer lifetime value, also CLV) is the contribution profit a customer leaves over a fixed period, such as 12 months: average order value × orders per customer × contribution margin. Use this profit version, not revenue, whenever you compare it with what you paid to acquire the customer, because revenue still contains goods and delivery you pay for.
LTV (period) = average order value × orders per customer in the period × contribution margin
Drop the margin and you get revenue LTV. It is fine for a sales forecast, but only contribution LTV can be set against acquisition cost.
Worked example: a pet-food cohort
A pet-food shop takes every customer whose first order was in January last year and follows them for 12 months. There were 800 of them.
- Orders placed by this group in those 12 months: 2,800, so 2,800 ÷ 800 = 3.5 orders per customer
- Average order value: €42.00 without VAT
- Revenue LTV: €42.00 × 3.5 = €147.00
- Contribution margin after food, delivery and fees: 35%
- Contribution LTV: €147.00 × 0.35 = €51.45
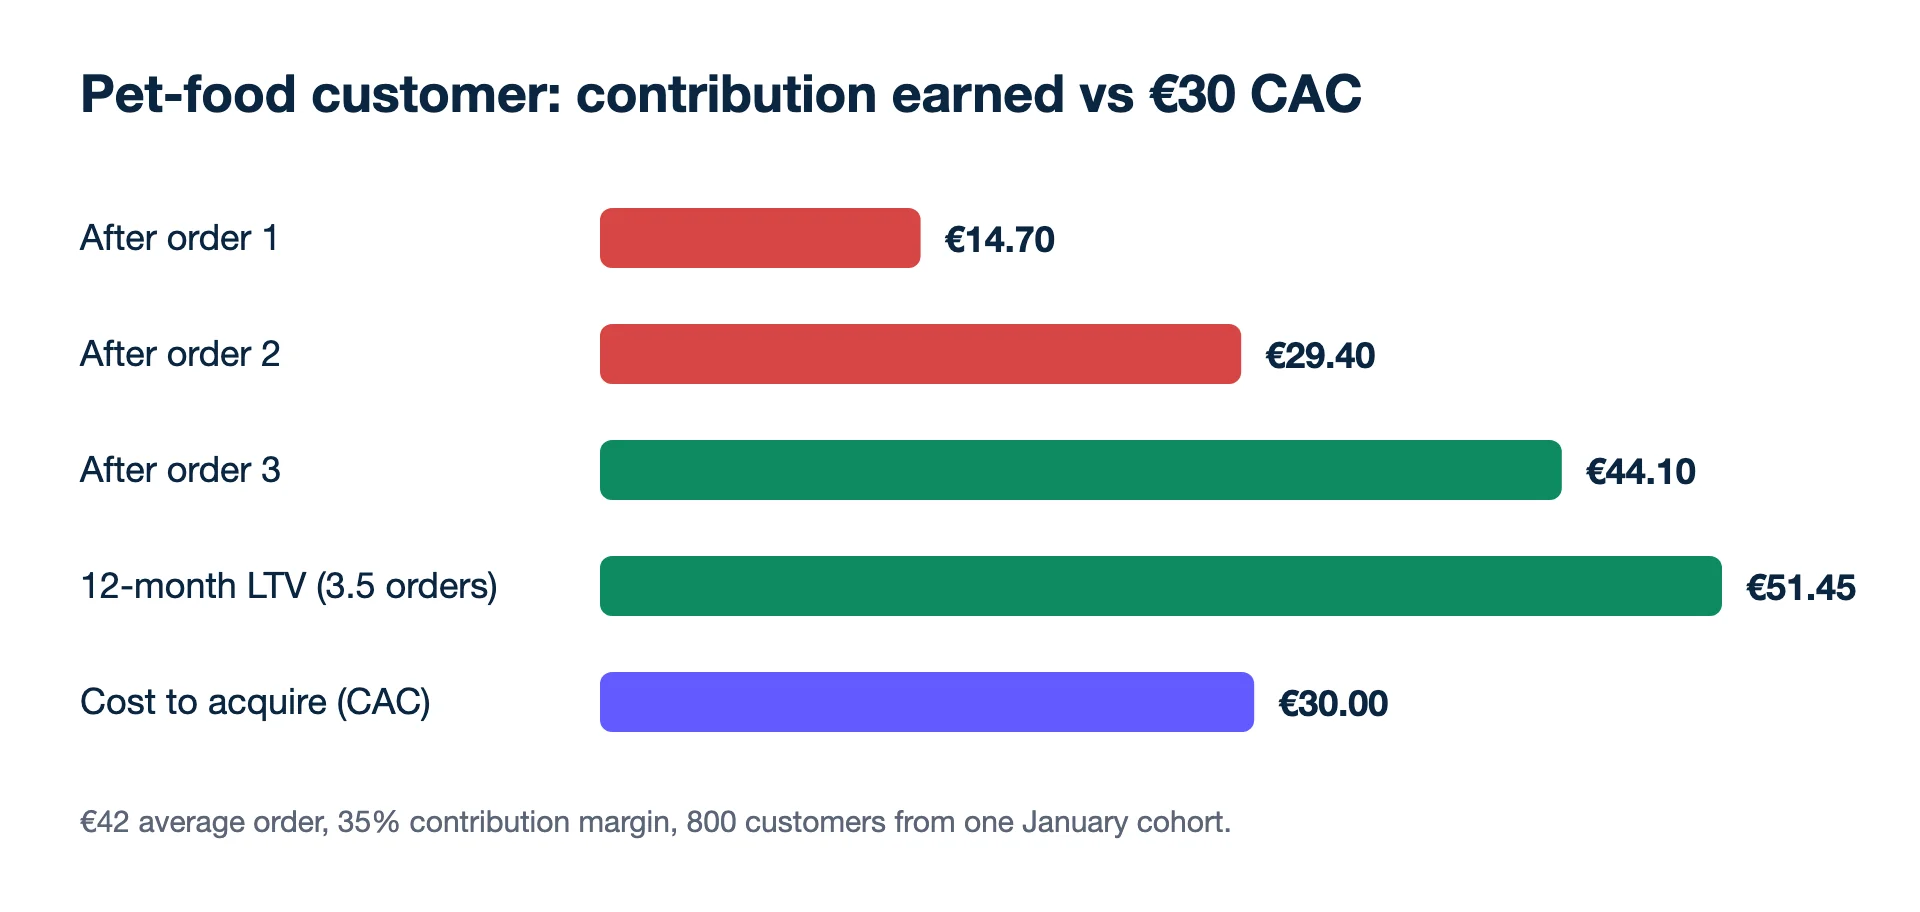
The first order alone leaves €42.00 × 0.35 = €14.70. A customer acquired for €30 is €15.30 down after day one, €0.60 down after the second order (€29.40 earned) and €14.10 ahead after the third (€44.10). Judged on first-order ROAS, this shop's prospecting looks like a loss; on 12-month LTV it pays.
Second example: a coffee subscription over six months
Subscriptions churn instead of reordering at will, so the arithmetic counts deliveries. A roaster starts 500 subscribers in March at €24.00 a delivery, monthly, and keeps 40% after beans, packaging and postage (€9.60 a delivery).
- Deliveries to the March cohort in its first six months: 1,900, so 1,900 ÷ 500 = 3.8 per subscriber
- Six-month revenue LTV: 3.8 × €24.00 = €91.20
- Six-month contribution LTV: 3.8 × €9.60 = €36.48
If a subscriber costs €45 to acquire through a discounted first box, the roaster has not paid back after six months. It either needs the second half-year to land, or a cheaper offer. The time it takes to get the money back is the payback period.
Why measure LTV from cohorts and not averages?
Because an all-time average mixes customers of very different ages. Dividing total revenue by total customers puts someone who joined three years ago next to someone who joined last week, so it says little about what a customer bought today will be worth. Grouping customers by first-order month and following each group forward is slower but honest. It also shows whether newer cohorts repeat as well as older ones, which is often the first sign that cheaper acquisition is bringing weaker customers.
How do Google and GA4 use lifetime value?
Google Ads does not ask you for an LTV number; it lets you bid differently for new customers. Its customer lifecycle goals include "New Customer Value", which bids towards new customers while still reaching returning ones, and "High Value New Customer", which sets a different priority for new customers you define as high value from your own data. Google says these goals can help grow lifetime value, but it does not define how LTV is calculated, so the definition stays yours.
GA4 offers a forecast rather than a history: its predicted revenue metric is the revenue expected from purchase events in the next 28 days from a user active in the last 28. It only appears once a property has enough returning users who did and did not purchase, and only if the site sends purchase events carrying a value and currency, so smaller shops often never see it. Neither replaces a cohort table built from your own orders.
Where LTV goes wrong
- Revenue LTV against CAC. Comparing €147 with a €50 CAC says 2.9:1; the real comparison is €51.45 against €50, roughly even.
- Infinite horizons. Formulas that divide by churn rate project far into the future. Stick to a period you have observed.
- Young cohorts averaged in. A cohort that is four months old has not had 12 months to buy.
- Discounted repeat orders. If repeat orders come mostly with heavy codes, their margin is lower than the first order's. Use the margin of the orders actually placed.
- One LTV for all channels. Customers from a discount-led campaign and from brand search often repeat at very different rates. Split by first-touch source if you can.
- One-off products. A sofa or a wedding dress is rarely bought twice in a year; for those shops LTV adds little and first-order profit is the number.
Put your own figures into the LTV:CAC calculator, which sets LTV against acquisition cost as the LTV:CAC ratio.
See also
- Google Ads Help: About customer lifecycle goals (New Customer Value, High Value New Customer) (checked 2026-11-19)
- Analytics Help: [GA4] Predictive metrics (predicted revenue, eligibility) (checked 2026-11-19)
- Google for Developers: GA4 recommended events (purchase event, value and currency parameters) (checked 2026-11-19)
- Example figures are illustrative, not a client's data.
Would rather not do this by hand? Kunads' agents check every campaign against your margin each day and propose a fix you approve or ignore.
Audit my ads for free Try Kunads, no cardLTV for a young shop
Over what period should I measure LTV?
A period you can fund and have data for, usually 6, 12 or 24 months. A lifetime figure based on guesses about year five is not something to bid on.
My shop is eight months old. Can I still use LTV?
Yes, on a shorter window. Measure 3-month and 6-month LTV on the cohorts that have had that long, and set acquisition costs against those. Move to 12 months once your oldest cohorts have lived a full year.
Is a predicted LTV from a tool good enough to bid on?
Use it as a forecast, not a fact. Compare each month's prediction with what the cohort actually bought, and only lean on it once the two have stayed close for a few months.