Payback period
The payback period is how long the contribution from a newly acquired customer takes to repay what it cost to acquire them. If a customer costs €45 to win and leaves you €9 of contribution a month, payback is five months. Use contribution, never revenue, and count churn, or the answer comes out too short.
How do you calculate the payback period?
Divide acquisition cost per customer by the contribution that customer leaves each month. That is the quick version; it works when payments are steady.
Payback period (months) = CAC ÷ monthly contribution per customer
Here monthly contribution = average monthly revenue per customer × contribution margin, and CAC is acquisition spend ÷ new customers won. Shops with irregular repeat orders, and subscriptions where people cancel, need the cohort method: add up the cohort's contribution month by month, per customer originally acquired, until it passes CAC.
Worked example 1: a subscription, before and after churn
A meal-kit subscription charges €99 a month. After food, packaging, delivery and payment fees it keeps 30%: €99 × 0.30 = €29.70 per paying subscriber per month. Ads won 200 new subscribers for €18,000, so CAC is €18,000 ÷ 200 = €90.
The quick formula says 90 ÷ 29.70 = 3.0 months. But not everyone keeps paying. The cohort's retention, measured on the subscribers who joined last spring, was 100% in month 1, 85% in month 2, 70% in month 3 and 62% in month 4. Per original subscriber:
- Month 1: €29.70 × 1.00 = €29.70, cumulative €29.70
- Month 2: €29.70 × 0.85 = €25.25, cumulative €54.95
- Month 3: €29.70 × 0.70 = €20.79, cumulative €75.74
- Month 4: €29.70 × 0.62 = €18.41, cumulative €94.15
With churn, the €90 is repaid in month 4, not month 3. A month sounds small, but it is a third more cash tied up per cohort, and the gap grows as CAC rises.
Worked example 2: a shop cohort
A pet food shop acquires 400 new customers in March for €18,000 of ads: CAC €45. It tracks the cohort's cumulative contribution per customer (revenue × margin, net of refunds):
| Month | Contribution added | Cumulative | Repaid? |
|---|---|---|---|
| 0 (first order) | €18 | €18 | No |
| 1 | €6 | €24 | No |
| 2 | €7 | €31 | No |
| 3 | €5 | €36 | No |
| 4 | €6 | €42 | No |
| 5 | €5 | €47 | Yes |
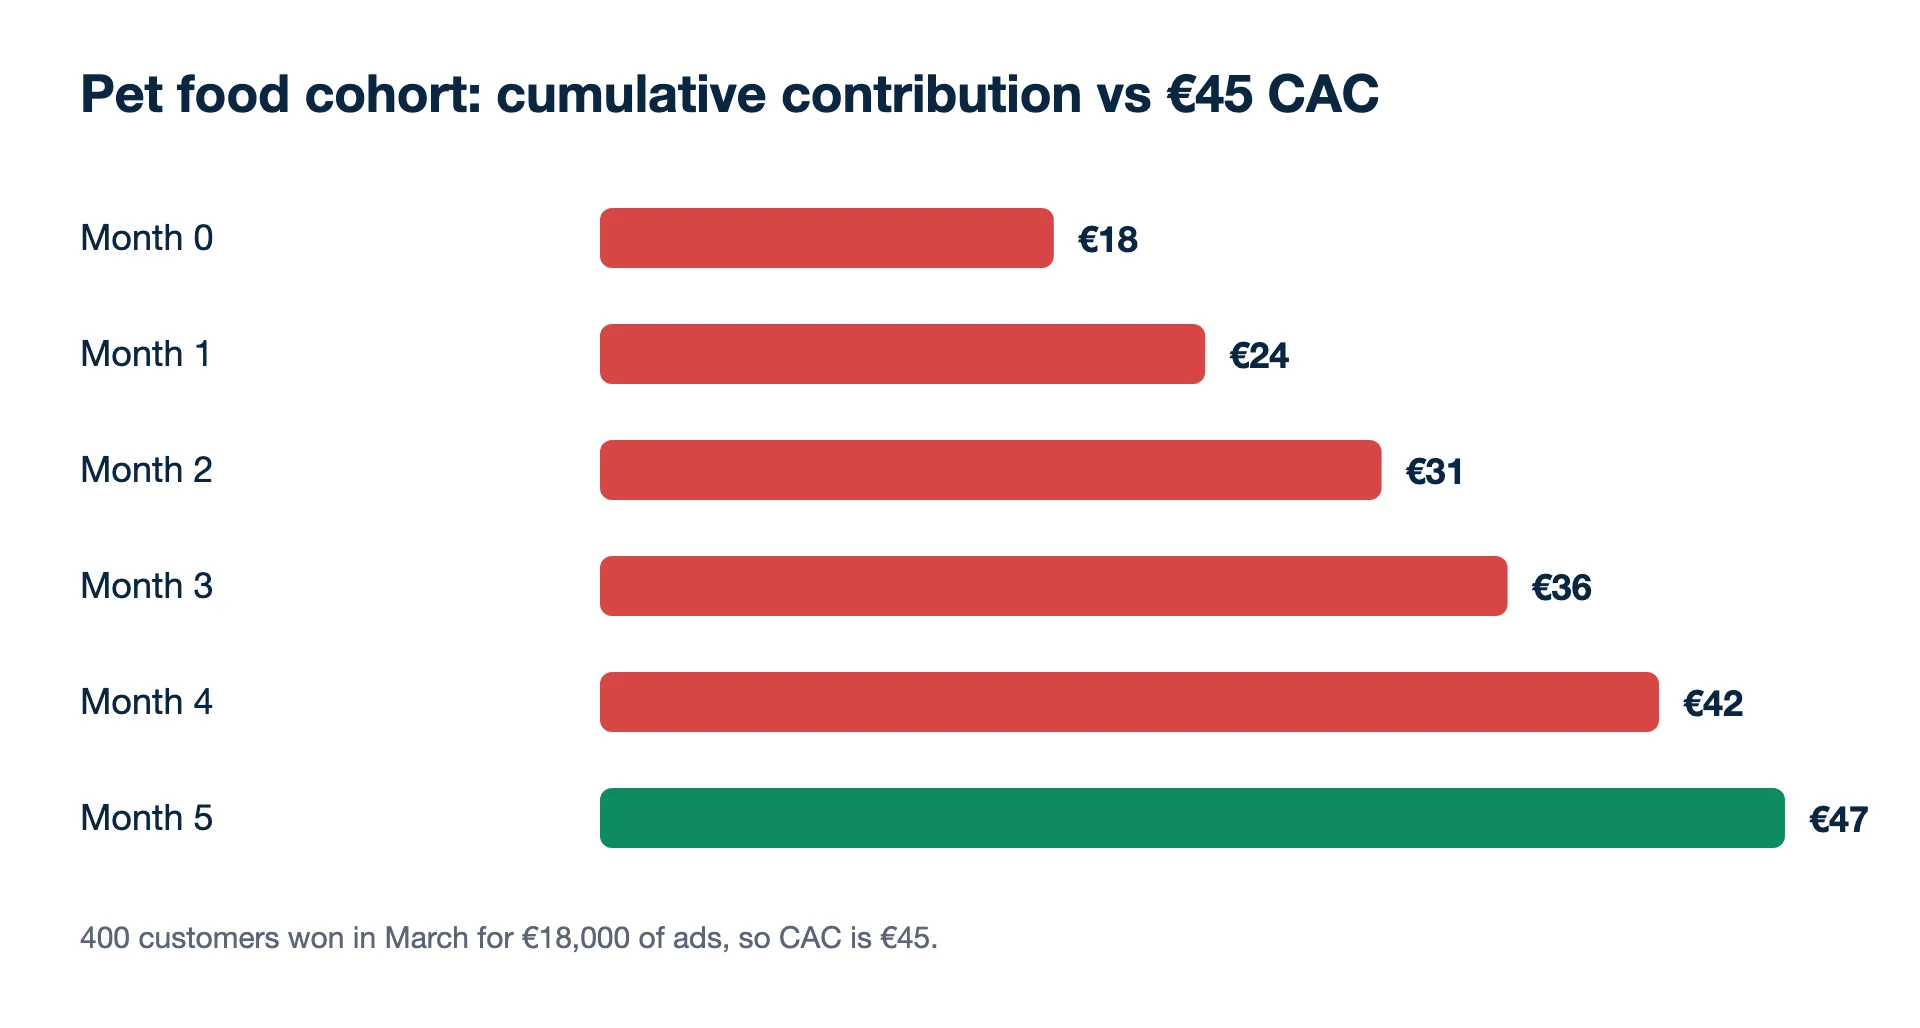
Checks: 18,000 ÷ 400 = €45; 18 + 6 + 7 + 5 + 6 + 5 = 47. The cohort repays its €45 in month five. At the worst point the shop is carrying €27 per customer (45 − 18), or 400 × 27 = €10,800 out of pocket for this one cohort. Win a new cohort every month and those amounts stack until the first ones start paying back.
Seen through first-order ROAS alone, this campaign is a loss: €18 of contribution against €45 of cost. Seen through payback, it is a five-month investment. Which view wins depends on whether the shop can fund five months, and on whether the repeat pattern is measured or assumed.
What is a good payback period?
One your cash can carry, with room for the later months to disappoint. There is no platform rule or published standard. A shop with little cash may need payback on the first order. A business with savings or funding may accept six or twelve months, but every month further out is less certain: customers churn, competitors arrive, prices change. Shorter is safer, and a payback that only works if every cohort behaves like your best one is not a plan.
Payback also caps how fast you can grow. If each month's cohort ties up €10,800 for five months, raising acquisition spend by half raises the cash tied up by half too, even when every customer is profitable in the end.
Where the platforms help, and where they stop
Google Ads' customer lifecycle reporting can show New customers, Customer Acquisition Cost and New customer lifetime value columns for campaigns using its new-customer goals, limited to purchase conversions and only from the day the goal was activated. That gives you the CAC half of the sum per campaign. Meta's Conversions API accepts a predicted_ltv parameter (the predicted lifetime value of a conversion event) if you have a model that produces one. Neither platform knows your margins, refunds or repeat orders from other channels, so the contribution half has to come from your shop or finance data.
Traps in the calculation
- Using revenue instead of contribution. At a 30% margin, payback on revenue looks more than three times shorter than it is.
- Counting all customers, not new ones. Repeat buyers reached by retargeting have no acquisition cost to repay; mixing them in shortens payback.
- Leaving out churn, as example 1 shows.
- Borrowing repeat rates from a good year or from customers won in a sale month, who often return less.
- Counting only one channel's spend in CAC. If Meta found the customer and Google closed the sale, both costs belong in CAC.
To work through acquisition cost against lifetime value on your own numbers, use the LTV:CAC calculator.
Related terms
- Google Ads Help: Measure your lifecycle goals campaigns (checked 2026-11-19)
- Meta for Developers: Conversions API custom data parameters (predicted_ltv) (checked 2026-11-19)
- Subscription and cohort figures are illustrative examples.
Numbers from your shop, not from the ad platforms. Connect Meta, Google and Shopify, WooCommerce or Magento and see what each campaign kept.
Get my profit audit Open a free workspace