POAS (profit on ad spend)
POAS (profit on ad spend) is the contribution profit your ads brought in divided by what you spent on them. A POAS of 1.0 means the ads exactly paid for themselves; 1.3 means each €1 of ads left €1.30 of contribution, so €0.30 went towards fixed costs and profit. Unlike ROAS, the breakeven is the same for every shop.
How do you calculate POAS?
Subtract the costs that come with each order from its revenue, then divide by ad spend.
POAS = contribution profit from ad-driven orders ÷ ad spend
Contribution profit is revenue minus goods, payment fees, delivery you pay, packaging and refunds. If you know the contribution margin, there is a shortcut: POAS = ROAS × contribution margin. A ROAS of 4.0 at a 30% margin is a POAS of 1.2.
Worked example: two products, one budget
A sports-nutrition shop spends €1,000 on each of two products in the same week.
| Protein powder | Shaker bottles | |
|---|---|---|
| Ad spend | €1,000 | €1,000 |
| Revenue | €4,000 | €2,500 |
| ROAS | 4.0× | 2.5× |
| Contribution margin | 20% | 60% |
| Contribution profit | €800 | €1,500 |
| POAS | 0.80 | 1.50 |
| Result after ads | −€200 | +€500 |
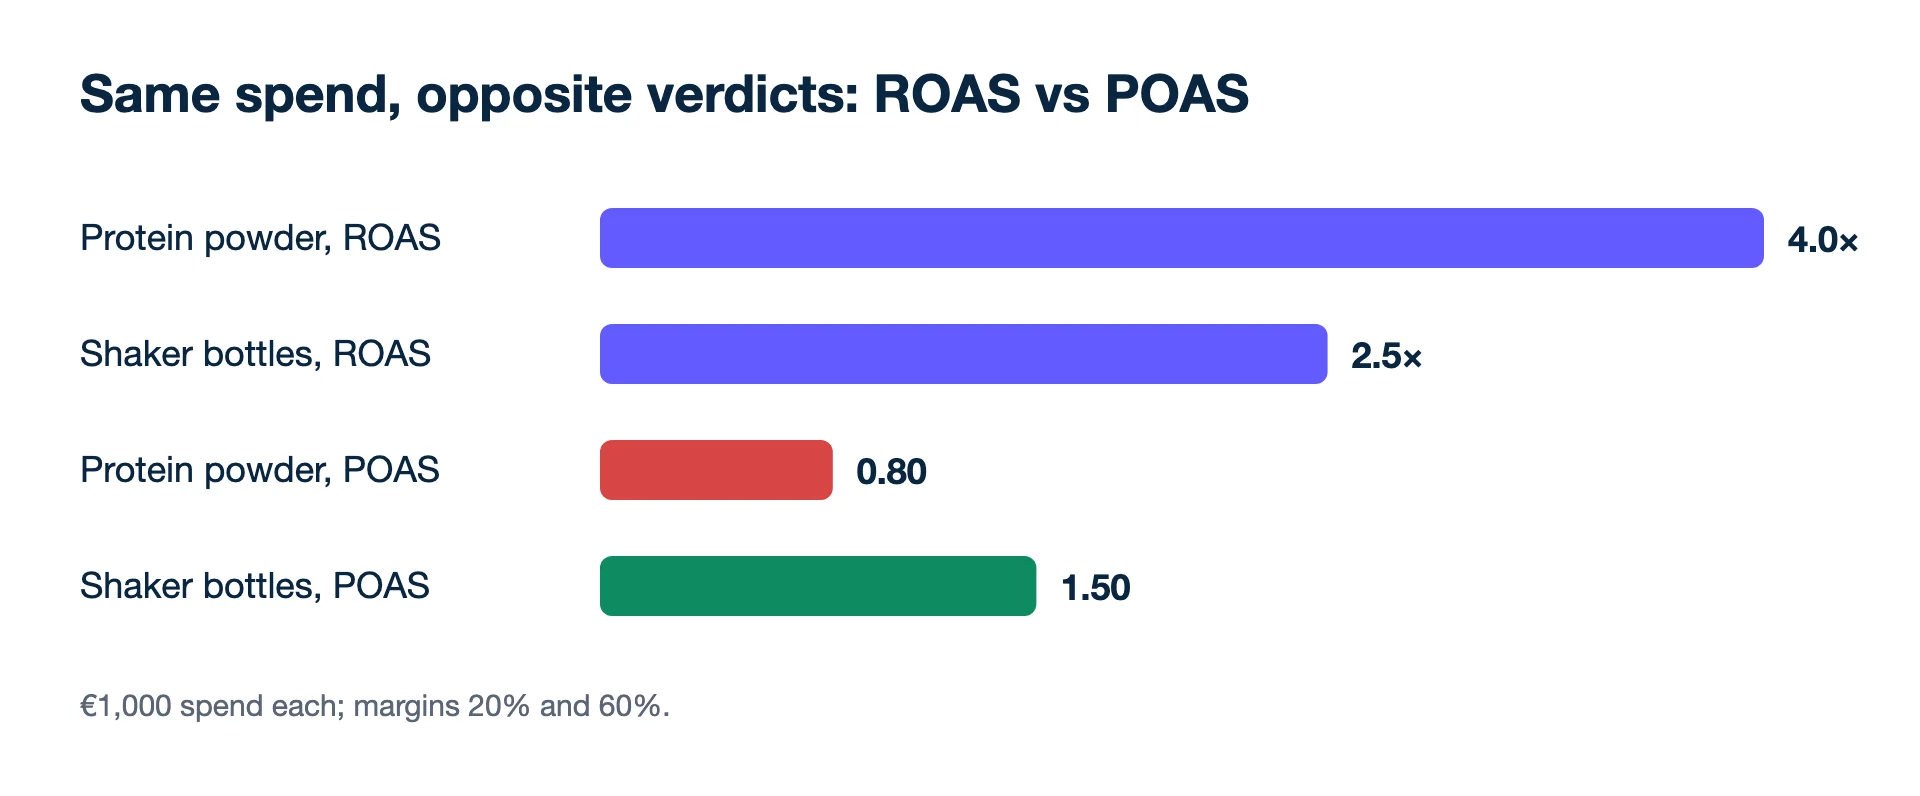
On ROAS, the powder wins. On POAS it loses €200 while the shakers make €500. A bidder fed revenue moves money towards the powder; one fed profit moves it the other way.
Second example: one order line, all the costs
Margins on a product page are not the whole story. Here is a homeware shop's Meta campaign for a month:
- Ad spend €2,000, revenue €7,000: ROAS 3.5
- Goods: €3,150 (45% of revenue), so gross margin is 55%
- Payment fees: €210 (3%)
- Delivery the shop pays: €600
- Refunds on items that could not be resold: €350
- Contribution: 7,000 − 3,150 − 210 − 600 − 350 = €2,690
- POAS: 2,690 ÷ 2,000 = 1.35
Using gross margin instead would give 3.5 × 0.55 = 1.93, a figure that suggests room to raise bids by almost half. The true 1.35 leaves much less. The difference is fees, delivery and refunds, which is why gross margin is the wrong input and contribution margin the right one.
What POAS should you aim for?
Above 1.0, by enough to cover fixed costs and leave a profit. If the shop's monthly rent, salaries and software come to €6,000 and ads drive most of its sales, a POAS of 1.05 on €20,000 of spend leaves only €1,000 to cover them. The target is a business decision, but "keep POAS above 1.2" means the same thing for every product, while a ROAS target has to be recalculated each time the margin changes.
When every product has a similar margin, POAS and ROAS rank campaigns the same way and the switch changes little. POAS earns its place when margins differ: own brand versus resold goods, accessories versus hardware, full price versus clearance.
Getting profit into the platforms
- Google, reporting: with conversions with cart data and a cost_of_goods_sold attribute in the Merchant Center feed, Google Ads reports gross profit per order (revenue − COGS). That is gross, not contribution: fees, delivery and refunds are not in it.
- Google, bidding: the help pages describe the profit figures as reporting. To bid on profit, send profit as the conversion value.
- Meta: the Conversions API has a separate net_revenue parameter, described as the margin value of a conversion event, next to the value parameter used for purchases and value optimisation.
Kunads shows real profit (revenue × measured margin − ad spend) and POAS per campaign, and can send profit back to Meta and Google as a separate conversion.
Two definitions in use
Most people use the definition above, where breakeven is 1.0. A few tools subtract ad spend first, (contribution − ad spend) ÷ ad spend, so breakeven becomes 0 and the shakers above would show 0.50 instead of 1.50. Neither is wrong; write down which one your reports use before comparing numbers across tools.
Errors that skew it
- One margin for the whole catalogue. Then POAS is ROAS × a constant and tells you nothing new.
- Keeping the old target after switching values. A Target ROAS of 400% on profit values will choke delivery.
- Mixing revenue sources. POAS from Ads Manager and POAS from shop orders differ because each counts sales its own way. Say which one you used.
To work it out for your own numbers, use the POAS calculator; the longer comparison is in POAS vs ROAS.
Related terms
- Google Ads Help: About conversions with cart data (checked 2026-11-19)
- Google Ads Help: Provide cost of goods sold (COGS) feed attribute to report on profit margins (checked 2026-11-19)
- Meta for Developers: Conversions API custom data parameters (value, net_revenue) (checked 2026-11-19)
Changes wait for you. Kunads proposes budget moves in 20% steps with the reasoning attached; nothing reaches Meta or Google until you press Approve.
See what it would change Begin a free trialPOAS when margins vary
Can I bid on POAS in Google or Meta?
Not as a named setting. You can send each order's contribution profit as the conversion value and use value-based bidding on it; the ROAS target then works as a POAS target. Convert the target when you switch: new target = old target × margin.
What if I do not know the cost of every product?
Estimate it and refine later. For its profit reporting, Google even suggests estimating cost of goods sold as 80% of the product price when precise data is missing. A rough per-category cost is still better than one margin for the whole catalogue.
Is a POAS just below 1.0 ever acceptable?
On first orders from new customers, sometimes, if measured repeat purchases pay the gap back. On repeat customers or retargeting, no: there is nothing later to recover the loss.