MER (marketing efficiency ratio)
MER (marketing efficiency ratio) is total revenue divided by total marketing spend for the same period. A shop that took €182,000 on €35,000 of ads has an MER of 5.20. It ignores which channel gets credit and answers one question: for every €1 spent on marketing, how much did the business take in?
MER = total revenue ÷ total marketing spend
Many teams treat MER and blended ROAS as the same thing: all revenue ÷ all ad spend. Others put every marketing cost in the bottom line, such as agency fees, influencer payments and creative production. Either works, as long as you write down which version you use and keep it the same from month to month.
Worked example: one month, two channels
A furniture shop's November, without VAT:
- Shop revenue, all orders: €182,000
- Meta Ads: €21,000; Google Ads: €14,000; total ad spend €35,000
- MER (ad spend only): €182,000 ÷ €35,000 = 5.20
The shop also paid an agency €4,000 and a photographer €1,000. With those included, marketing spend is €40,000 and MER is €182,000 ÷ €40,000 = 4.55. The same month viewed the other way round: €35,000 ÷ €182,000 = 19.2% of revenue went on ads.
What is a good MER?
A good MER is one that stays clearly above 1 ÷ your contribution margin, with enough room left to pay fixed costs. The furniture shop keeps 38% of each order after goods, delivery and payment fees, so its breakeven MER is 1 ÷ 0.38 = 2.63. Below that, every euro of ads loses money even before rent. At 5.20, ads take 19.2% of revenue and the shop keeps 38%, leaving 18.8% (about €34,200) for rent, salaries and profit. That leftover sum is worth tracking more closely than the ratio itself. There is no universal target: a shop on a 70% margin breaks even at 1.43, one on a 25% margin at 4.00.
Why does MER rise when I cut ad spend?
Because revenue that comes without ads stays in the top line while the spend shrinks. Repeat buyers, organic search and word of mouth do not stop when a campaign does. The furniture shop tried it in a quieter month:
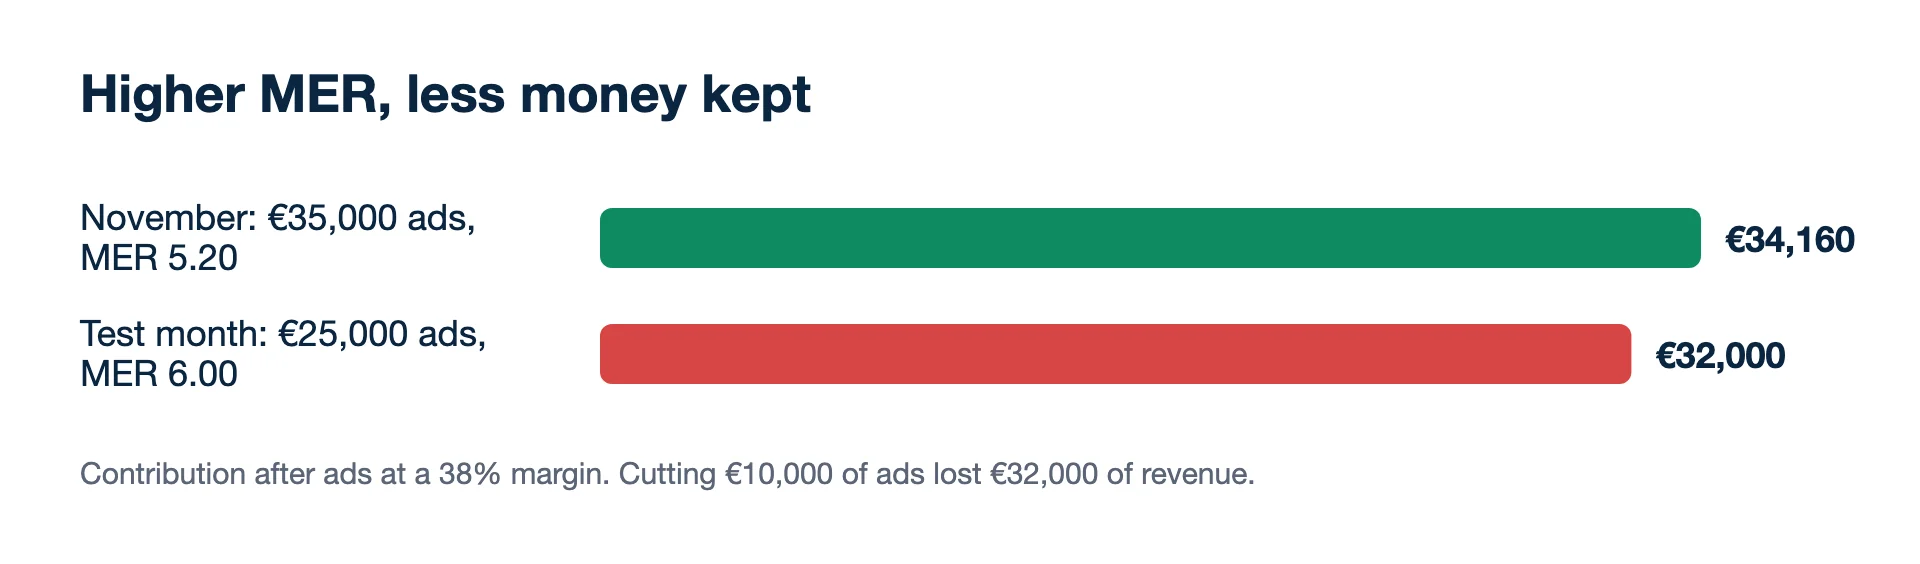
- November: €182,000 revenue on €35,000 of ads. MER 5.20. Contribution after ads: €182,000 × 0.38 − €35,000 = €69,160 − €35,000 = €34,160.
- Test month: ads cut to €25,000, revenue fell to €150,000. MER 6.00. Contribution after ads: €150,000 × 0.38 − €25,000 = €57,000 − €25,000 = €32,000.
MER went up from 5.20 to 6.00 and the shop kept €2,160 less. The €10,000 of ads that were cut had been bringing in €32,000 of revenue, which at a 38% margin is €12,160 of contribution: more than they cost. A rising MER after a cut does not prove the cut was right; the contribution line decides.
Why MER uses the shop's revenue, not the platforms'
The platforms count sales by their own rules, so adding up their revenue columns does not give the shop's total. Meta credits a purchase on your website to an ad if it happened within a set number of days after someone viewed or clicked it, using the attribution setting of each ad set. Google Ads counts a conversion within a conversion window after an ad interaction, which can be set from 1 to 90 days and is 30 days by default for Search and Display. Meta, Google and the shop count differently and never agree. The shop's order total and the platforms' invoices, on the other hand, are hard numbers, which makes MER the steadiest top-level check you have and a useful guard-rail when a platform figure moves because a setting changed rather than because sales did. Kunads steers accounts on exactly this number, blended ROAS, with each platform's own count shown beside it.
What MER cannot tell you
- Which campaign works. It is one number for the business. To cut or scale a campaign you still need a per-campaign view.
- Whether ads caused the sales. A brand with strong word of mouth has a high MER even with weak ads; the test month above shows how to probe it. For cause and effect, see incrementality.
- New versus returning. A large repeat-customer base lifts MER. If growth is the goal, watch new-customer ROAS next to it.
Errors that skew it
- Different periods on each side. Spend for 1–30 November against a "last 30 days" revenue report ending on the 28th describes no real period.
- Refunds left in. With high returns, use net revenue after refunds, or MER looks better than the bank account.
- VAT on one side only. Ad invoices are usually without VAT; take revenue without VAT too.
- Comparing MER across businesses. Margins differ too much for one target to mean anything.
The MER calculator works it out and draws the breakeven line from your margin.
Related terms
- Meta Business Help Centre: About Facebook's attribution system (checked 2026-11-19)
- Google Ads Help: About conversion windows (checked 2026-11-19)
- Example figures are illustrative, not a client's data.
Agencies: one screen for every client account, with each campaign measured on what the client kept and a white-label report each Monday.
Free audit for one client Trial for agencies