Blended ROAS
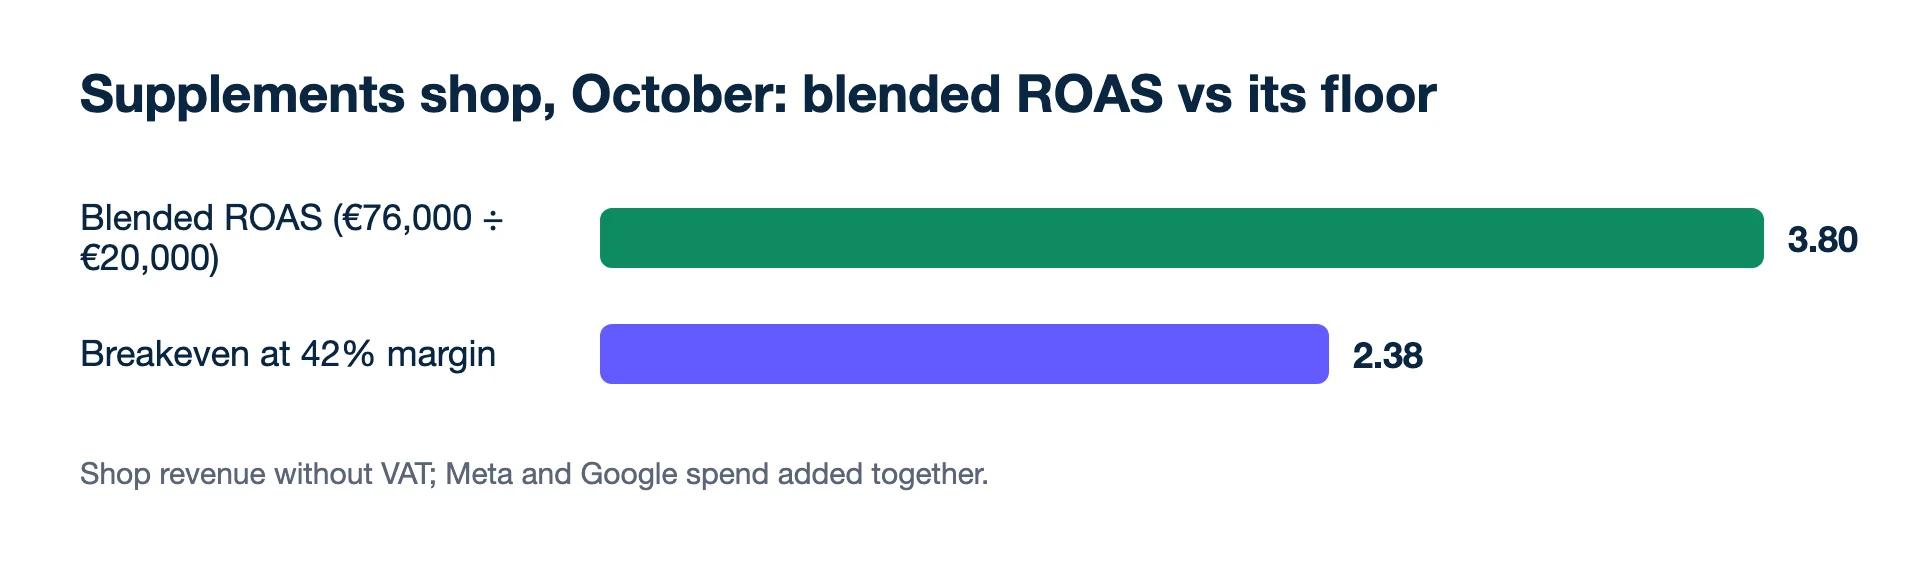
Blended ROAS is your total revenue divided by your total ad spend across every platform, for the same period. A shop that took €76,000 in a month on €20,000 of Meta and Google spend has a blended ROAS of 3.80. It counts each order once, from your own shop or CRM, and needs no attribution model.
Blended ROAS = all revenue ÷ all ad spend
"All revenue" means every order in the period, whether it came from an ad, an email, a search result or a friend's recommendation. That is a strength and a limit: the number cannot be distorted by tracking, but it cannot tell you which channel earned it either.
Worked example: Meta and Google together
A supplements shop's October, without VAT:
| Ad spend | Revenue each platform reports | |
|---|---|---|
| Meta Ads | €12,000 | €41,000 |
| Google Ads | €8,000 | €37,000 |
| Total | €20,000 | (not added up; see below) |
| Shop, all orders | €76,000 |
- Blended ROAS: €76,000 ÷ €20,000 = 3.80
- Shop contribution margin: 42%, so breakeven blended ROAS is 1 ÷ 0.42 = 2.38
- Contribution from all orders: €76,000 × 0.42 = €31,920; minus ad spend €20,000 = €11,920 left for fixed costs and profit
Why don't the platform figures add up to blended ROAS?
They do not add up because Meta and Google each report the sales they connect to their own ads, using their own attribution windows and methods. Meta's default credits a purchase within 7 days of a click or 1 day of a view; Google Ads' default conversion window runs 30 days after a click. The same order can appear in both, and some orders appear in neither. Each platform's figure is useful for steering within that platform. Only the shop's figure counts each order exactly once, which is why Kunads puts each platform's count beside the shop's and steers the account on the blended number.
What blended ROAS do I need?
You need at least 1 ÷ your contribution margin just to cover the ad spend, plus enough on top to pay fixed costs and leave a profit. For the supplements shop that floor is 2.38. The target above it comes from the money the business needs: the €11,920 in October has to cover salaries, rent and software before anything is profit. A shop selling consumables that people reorder may accept a lower blended figure in a growth month, but only if it has measured how quickly new customers come back; see payback period.
Second example: the month spend went up
In November the shop raises total spend from €20,000 to €26,000 and the shop takes €88,400. Blended ROAS falls to 88,400 ÷ 26,000 = 3.40, still well above 2.38, so at first glance the month looks fine. Now look at what the extra money did. The additional €6,000 of spend came with €12,400 of additional revenue (88,400 − 76,000), a return of 2.07 on the extra euros, below the 2.38 floor. Contribution after ads is 88,400 × 0.42 − 26,000 = €11,128, which is €792 less than October's €11,920. More revenue, less money left. The average still looked healthy; the last €6,000 did not pay. This is the most useful way to read blended ROAS when budgets change: compare the change in revenue with the change in spend, not only the ratio.
Where it misleads
- It includes sales ads did not cause. Repeat customers and organic traffic sit in the top line. For causal effect, see incrementality.
- It mixes new and returning customers. A large loyal base can hide weak acquisition. Track new-customer ROAS alongside.
- It cannot rank campaigns. Use platform or shop data per campaign for that.
- It rises when you cut spend. Turn off half the ads and the ratio improves almost by definition, while total contribution may fall. Check the euro figure, not only the ratio.
- Seasonality moves it without any ad change. A gift shop's December revenue lifts blended ROAS whatever the campaigns do; compare with the same month last year.
Getting the inputs right
- Count every channel's spend. Leave out TikTok or Microsoft spend and blended ROAS looks better than it is.
- Use net revenue. Take revenue after refunds and cancellations, without VAT and without shipping the customer paid.
- Match the dates. Spend and revenue must cover exactly the same days, in the same time zone as the shop.
The MER calculator works out blended ROAS and its breakeven from your margin. Related: MER, ROAS, attribution window.
- Meta Business Help Centre: Differences between conversion optimisations (attribution settings, default 7-day click or 1-day view) (checked 2026-11-19)
- Google Ads Help: About conversion windows (30-day click default) (checked 2026-11-19)
Changes wait for you. Kunads proposes budget moves in 20% steps with the reasoning attached; nothing reaches Meta or Google until you press Approve.
See what it would change Begin a free trialBlended ROAS or MER?
Is blended ROAS the same as MER?
In most usage, yes. Some teams include non-ad marketing costs (agency fees, influencers) in MER, which makes it lower than blended ROAS. Say which you use.
Should blended ROAS include orders from returning customers?
Yes. By definition it includes every order in the period, which is why it is best read next to new-customer ROAS, built from first orders only.