Incrementality
Incrementality is the part of your results that advertising actually caused: the sales, leads or sign-ups that would not have happened without the ads. You measure it by comparing people or regions that could see the ads with comparable ones that could not. Sales that came near an ad but would have arrived anyway are not incremental.
Incremental conversions = conversions with ads − conversions that would have happened without ads
Incremental ROAS = incremental revenue ÷ ad spend
The hard part is the second term. Nobody can see the world where the ads did not run, so every method builds a stand-in for it: a randomised holdout group, a set of regions without ads, a period with the channel off, or a statistical model.
How is incrementality different from attribution?
Attribution decides which ad gets credit for a sale that happened; incrementality asks whether the sale needed the ad at all. A loyal customer who sees a retargeting ad and then buys, as they were going to anyway, is attributed to the ad and is not incremental. Last click, 7-day click and data-driven models are all attribution rules. Meta itself says its lift test results are not meant to be compared with Ads Manager results, because lift tests count all conversions in test and holdout groups, while Ads Manager shows conversions attributed to specific ads in specific windows.
Worked example: a lift test
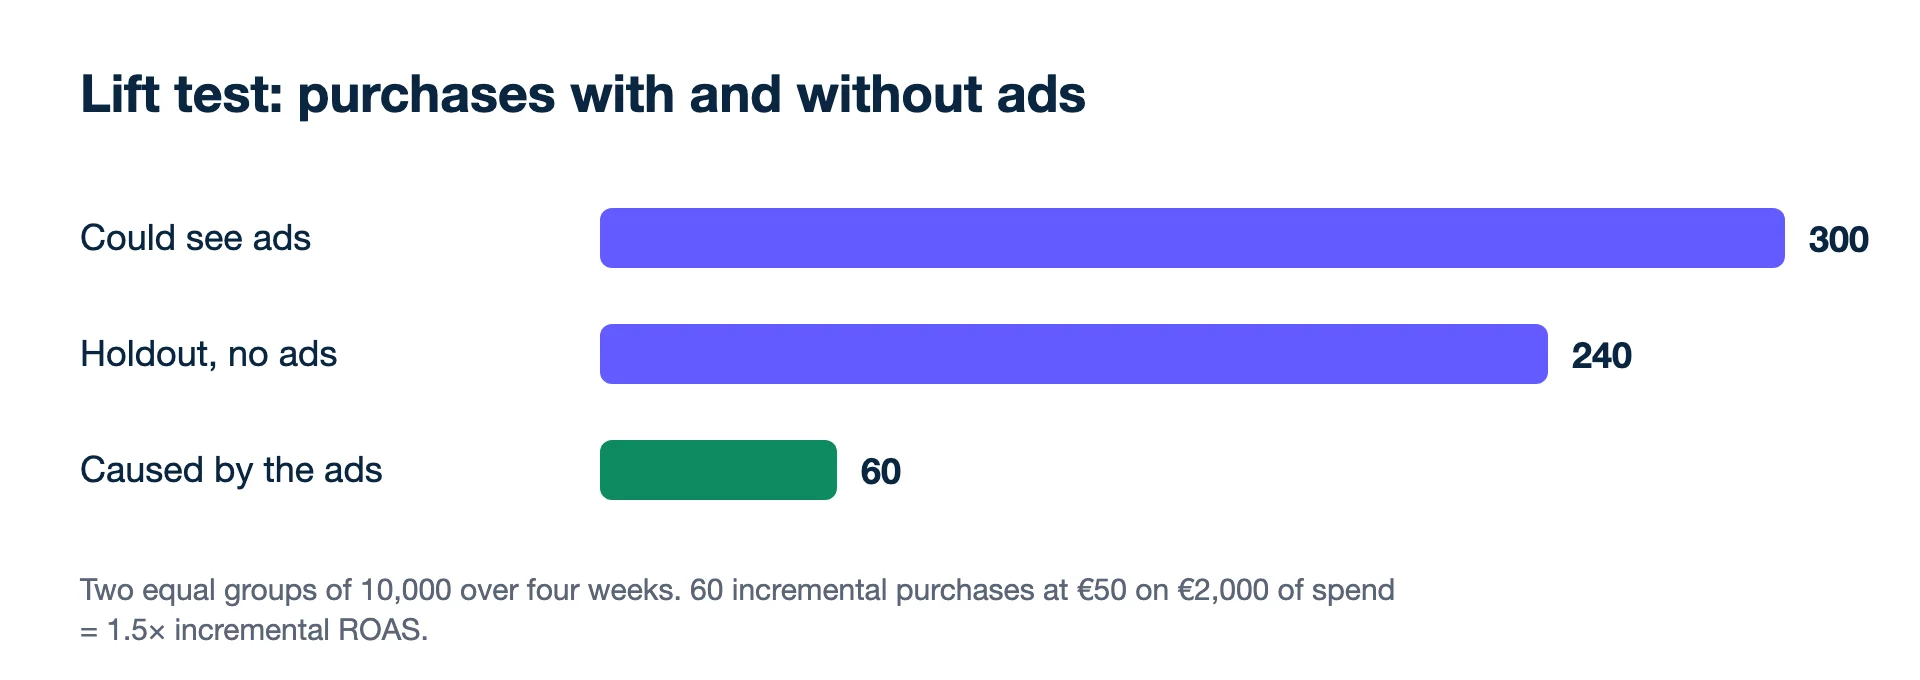
An electronics shop splits a matched audience at random into two equal groups of 10,000 for four weeks. One can see its Meta ads; the other cannot.
- Test group (could see ads): 300 purchases, a 3.0% rate
- Holdout group (no ads): 240 purchases, a 2.4% rate
- Incremental purchases: 300 − 240 = 60
- Lift: 60 ÷ 240 = 25% more purchases with the ads
- Share of the test group's purchases the ads caused: 60 ÷ 300 = 20%
Average order €50, ad spend on the test group €2,000:
- Incremental revenue: 60 × €50 = €3,000
- Incremental ROAS: €3,000 ÷ €2,000 = 1.5×
An attributed ROAS for the same campaign would count purchases that came after an ad view or click, including some of the 240 that would have happened anyway, so it answers a different question. If the shop's breakeven ROAS is 2.0×, the incremental view says this audience loses money, whatever the attributed figure shows. That is the decision incrementality changes.
A second case: when attributed and incremental results diverge most
A cosmetics shop runs two Meta campaigns at €3,000 a month each and tests both with holdouts of equal size.
- Retargeting (site visitors and past buyers): the test group makes 500 purchases, the holdout 450. Incremental purchases: 50. At a €40 average order, that is €2,000 of incremental revenue, an incremental ROAS of €2,000 ÷ €3,000 = 0.67×.
- Prospecting (people new to the brand): the test group makes 200 purchases, the holdout 80. Incremental purchases: 120, or €4,800 of revenue, an incremental ROAS of €4,800 ÷ €3,000 = 1.6×.
Retargeting has far more purchases near its ads (500 against 200), so any attribution report will favour it. The holdout shows that 90% of those buyers (450 of 500) would have bought anyway. Moving part of the retargeting budget to prospecting is the decision the test supports. This is also why one account-wide lift figure hides more than it shows.
How do you measure incrementality?
You compare a group exposed to the ads with a group that was not, chosen so that the ads are the only difference. The main options:
- Randomised holdout: the platform withholds ads from a random group. Meta runs lift tests this way; Google Ads offers Conversion Lift, based on users or on geography, and reports incremental conversions, incremental value and incremental ROAS. Google says Conversion Lift is not available to every account. See holdout test for a scaled example.
- Geographic test: ads run in some regions and not in comparable others.
- Pause test: switch a channel off for a period and compare sales with what was expected.
- Models on history: a marketing mix model estimates each channel's effect from long runs of spend and sales. Google's open-source Meridian model can take experiment results as priors, so a model and a test can be used together rather than as rivals.
Limits to keep in mind
- Tests too small or too short. With few conversions, a 25% lift and no lift at all can look the same. Meta reports a confidence figure; read it.
- Results expire. Incrementality changes with season, audience, offer and creative. A test from last spring says little about this Black Friday.
- Other changes during a test. A price change or email campaign mid-test muddies the comparison.
- Testing costs sales. The holdout does not see ads for weeks. That is the price of the answer, and a reason to test the campaigns where the decision is largest, not everything at once.
Day to day, platforms keep reporting attributed results, and Meta, Google and the shop count differently and never agree. Steering the whole account on blended ROAS (all revenue ÷ all ad spend) and testing incrementality now and then are complementary. Why the counts differ in the first place is covered in why Meta, Google and the shop never agree.
Related terms
- Meta Business Help Centre: About lift and holdouts in Facebook advertising tests (checked 2026-11-19)
- Meta Business Help Centre: Differences between conversion lift test results and other reporting tools (checked 2026-11-19)
- Google Ads Help: About Conversion Lift (checked 2026-11-19)
- Google for Developers: Meridian, open-source marketing mix model (checked 2026-11-19)
Breakeven, per campaign. Give Kunads your margin once; it marks which Meta and Google campaigns sit below it and by how many euros.
Find my losing campaigns Try it for 14 daysBefore you trust an incrementality number
How long should an incrementality test run?
Long enough to cover the usual delay between seeing an ad and buying, and to collect enough conversions in both groups for the confidence figure to mean something. Neither Meta nor Google publishes one length that suits every account.
Is incrementality the same for every campaign?
No. Retargeting and brand search reach people who are already close to buying, so more of their attributed sales would have happened anyway; prospecting reaches people who had not decided. Test them separately rather than reading one number for the whole account.