Holdout test
A holdout test measures what advertising adds by keeping a comparable group from seeing the ads and comparing its results with the group that could. The gap between the two, after scaling the holdout to the same size, is the incremental effect: the conversions that would not have happened without the ads.
Incremental conversions = test group conversions − holdout conversions (scaled to the test group's size)
Lift = incremental conversions ÷ scaled holdout conversions
How do Meta and Google run a holdout test?
Both split an audience at random into a group that can see the ads and a group that cannot, then compare conversions. Meta's lift tests follow these steps: choose an objective and campaign to test; divide the intended audience at random into test and holdout groups, which people stay in for the whole test; let the test group have the opportunity to see the ads while the holdout is withheld; measure actions in both groups; and compare them to calculate lift with a confidence percentage. When the groups differ in size, Meta first scales the holdout up to the test group's size.
Google Ads calls its version Conversion Lift and names the groups treatment and control. It offers two kinds of study: one based on users, built from aggregated user attributes, and one based on geography, which also accepts offline data. Depending on the study, Google reports incremental conversions, relative lift, incremental value and incremental ROAS. Google states that Conversion Lift is not available for every account; you may need to go through a Google representative.
Meta adds a warning worth repeating to anyone who reads the result: lift results are specific to the test's conditions and should not be compared with Ads Manager, because lift counts all conversions in both groups while Ads Manager counts conversions attributed to ads within attribution windows.
Worked example: an uneven split
A fashion brand runs a four-week lift test with a 90/10 split.
- Groups: test 900,000 accounts, holdout 100,000.
- Purchases: test 4,500, holdout 400.
- Scale the holdout: the test group is 9 times larger, so 400 × 9 = 3,600 purchases expected without ads.
- Incremental purchases: 4,500 − 3,600 = 900.
- Lift: 900 ÷ 3,600 = 25%.
- Money: average order €70, spend €30,000. Incremental revenue 900 × €70 = €63,000, so incremental ROAS is €63,000 ÷ €30,000 = 2.1×.
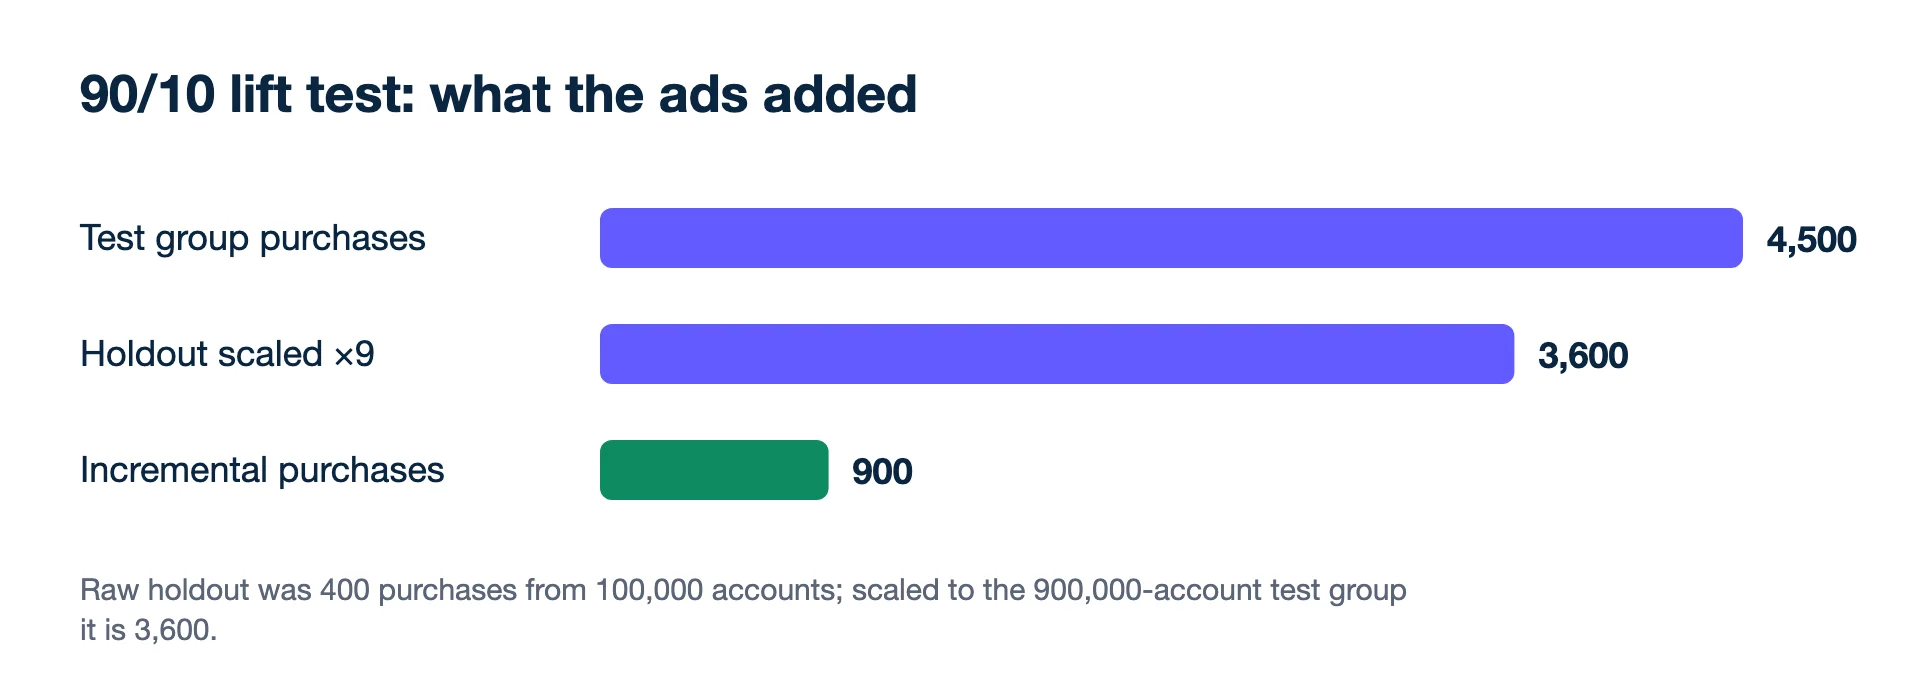
Comparing raw totals (4,500 vs 400) without scaling would be meaningless; the groups are different sizes.
How is a holdout test different from an A/B test?
An A/B test compares two versions of advertising; a holdout test compares advertising with none. Meta draws the line itself: A/B tests do not include a randomised group that is withheld from ads, so they can tell you which creative or audience did better, but not what either adds over showing nothing. If the question is "is this channel worth its budget at all?", only a holdout answers it.
A pause test you can run without a platform tool
A shop can also hold out time instead of people: switch a channel off and see what sales do.
- Last four weeks with Meta on: 1,000 orders a week on average, Meta spend €8,000 a week.
- Same weeks last year, the shop's orders moved by less than 3% week to week, so seasonality is small.
- Two weeks with Meta paused: 760 orders a week on average.
- Orders lost: 240 a week. At a €55 average order, that is €13,200 of revenue a week.
- Incremental ROAS: €13,200 ÷ €8,000 = 1.65×.
Against a breakeven of 2.0×, Meta as run here costs more than it brings. Against a breakeven of 1.5×, it pays. Pause tests are cruder than randomised ones (anything else that changes in those weeks gets blamed on the pause), but they use your own orders and need no special setup.
A regional holdout, for shops that sell in several areas
Between a randomised lift test and a full pause sits the geographic holdout: switch ads off in some regions and keep them on in comparable others. Suppose a shop sells in six similar regions. It keeps Google Shopping running in three and pauses it in the other three for four weeks. Before the test, both sets of regions produced about 2,000 orders each over four weeks. During the test, the "on" regions produce 2,100 orders and the "off" regions 1,750.
- Expected without ads in the "on" regions: about the same as the "off" regions, 1,750.
- Incremental orders: 2,100 − 1,750 = 350.
- Spend in the "on" regions: €9,000. Average order €60, so incremental revenue is 350 × €60 = €21,000.
- Incremental ROAS: €21,000 ÷ €9,000 = 2.33×.
The weak point is the match. If one region had a heatwave or a local competitor closed, the difference is partly that. Pick regions that tracked each other closely before the test, and check that they still did in the weeks before you start.
Where holdout tests go wrong
- Too few conversions. If the holdout records 15 purchases, the result is mostly noise. Meta reports confidence for a reason; read it before the lift figure.
- Ending early. Many purchases happen days after an ad. Stopping as soon as the numbers look good overstates the effect, and the reverse also happens.
- Changing other things mid-test. New prices, a big email or another channel's budget change spoil the comparison.
- Forgetting seasonality in pause tests. Compare with the same weeks last year or a region that stayed on.
- Reading one test as permanent. Results hold for those conditions. Re-test when the audience, offer or season changes.
- Putting the lift ROAS next to the platform ROAS. They count different things, as both Meta and Google describe. Use the lift figure for the yes-or-no decision on a channel and the platform report for day-to-day steering.
Holdouts are the measured counterpart to incrementality as a concept, and the check that a marketing mix model should be calibrated against.
See also
- Meta Business Help Centre: About lift and holdouts in Facebook advertising tests (checked 2026-11-19)
- Meta Business Help Centre: Differences between conversion lift test results and other reporting tools (checked 2026-11-19)
- Meta Business Help Centre: Similar performance between test and holdout groups (checked 2026-11-19)
- Google Ads Help: About Conversion Lift (checked 2026-11-19)
Lead generation? Send won deals from your CRM and Kunads ranks campaigns by what the leads were worth, not by how many came in.
Check my lead campaigns Start free for 14 days