Marketing mix modeling
Marketing mix modeling (MMM) is a statistical method that explains total sales over time with the spend on each channel plus outside factors such as seasonality, prices and promotions. It estimates how much each channel adds and where extra spend stops paying, without tracking a single user, which is why it survives consent banners and ad blockers.
How does an MMM split sales between channels?
It fits a regression of weekly sales on weekly spend per channel and reads each channel's share from the fitted effects. At its simplest:
Salesweek = base + Σ (effect of channel spend, with carry-over and saturation) + seasonality + price + promotions + noise
- Base is what you would sell with no ads: brand, repeat customers, word of mouth.
- Carry-over (adstock) lets this week's ads keep working next week.
- Saturation bends the curve: the second €10,000 on a channel adds less than the first.
Two open-source models are widely used. Google's Meridian lets you turn experiment results into priors for the model and can model reach and frequency for video. Meta Marketing Science's Robyn uses ridge regression to cope with channels whose spend moves together, calibrates against ground-truth tests such as geo experiments and lift studies, and includes a budget allocator. Commercial options exist too.
Worked example: one quarter decomposed
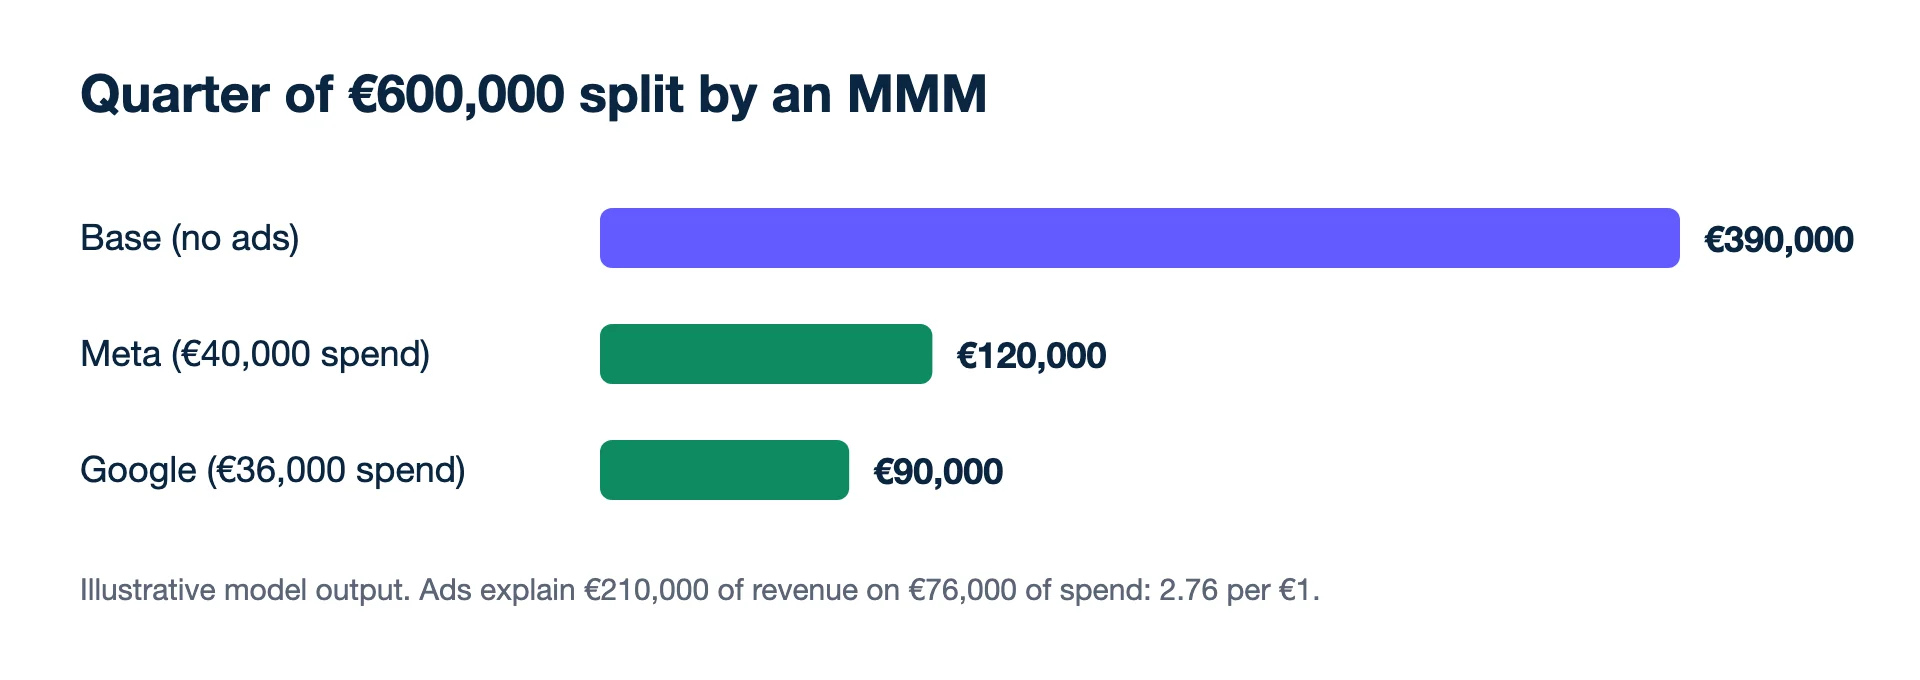
A shop sold €600,000 in a quarter. A model fitted on two years of weekly data splits it like this:
| Source | Revenue | Spend | Revenue per €1 |
|---|---|---|---|
| Base (no ads) | €390,000 | – | – |
| Meta | €120,000 | €40,000 | 3.0 |
| €90,000 | €36,000 | 2.5 | |
| Total | €600,000 | €76,000 |
The totals check: 390,000 + 120,000 + 90,000 = €600,000. Blended ROAS is 600,000 ÷ 76,000 = 7.89, but the model says only €210,000 of it came from ads, so revenue per €1 of ads is 210,000 ÷ 76,000 = 2.76. The rest would have arrived anyway, according to the model.
Second example: average versus the next euro
The more useful output is the response curve, which gives a marginal return. Reading the same model's Meta curve in steps:
- First €20,000 of Meta spend: adds €70,000 (3.5 per €1)
- Next €20,000: adds €50,000 (2.5 per €1)
- Together: €120,000 on €40,000, the 3.0 average in the table
- A further €10,000 (not yet spent): the curve predicts €18,000, or 1.8 per €1
With a 50% contribution margin, 1.8 means each extra €1 brings back €0.90 of contribution: a loss of €0.10 per euro. The average of 3.0 says scale; the marginal 1.8 says stop. Most budget mistakes made with MMM come from reading the first number when the decision needs the second.
When is MMM worth the effort?
MMM pays off when you spend across several channels, including ones no pixel can see, and have about two years of history with real swings in spend. TV, podcasts, outdoor and the base itself only appear in a model like this, and it answers the budget question attribution cannot: what happens if €20,000 moves from one channel to another? It is not worth it for a shop on one or two channels with flat budgets, because the model has nothing to learn from.
The honest limits
- Correlated spend confuses it. If Meta and Google always rise together before Christmas, the model struggles to say which did the work. Regularisation, as in Robyn, softens this but cannot invent the missing variation.
- Slow. It reads quarters and seasons, not yesterday's ad set. It will not tell you which creative to pause.
- Model choices drive answers. Two analysts on the same data can get different splits. Both open-source tools treat experiments as the check: calibrate with a holdout test where you can.
- Missing promotions. Leave out a sale weekend and the model credits it to whichever channel spent most that week.
- Refitting monthly. Small changes in data move the estimates; acting on each wobble is acting on noise.
MMM, attribution and Kunads
Attribution shares out individual sales along paths; MMM estimates how total sales move when spend moves. Neither proves cause on its own, which is why tests sit next to both. Kunads does not build an MMM: it puts each platform's count beside the shop's orders and steers on blended ROAS, which you can check for any period with the MER calculator.
Related terms
- Google for Developers: Meridian, open-source marketing mix model (checked 2026-11-19)
- Meta Marketing Science: Robyn, open-source MMM package (checked 2026-11-19)
- Example figures are illustrative, not a client's data.
Changes wait for you. Kunads proposes budget moves in 20% steps with the reasoning attached; nothing reaches Meta or Google until you press Approve.
See what it would change Begin a free trialIs MMM worth it for a small brand?
How much data does MMM need?
Typically around two years of weekly or daily data per channel, with enough variation in spend to tell channels apart. With a year or less, or with spend that never changes, the estimates are wide.
Are there free MMM tools?
Yes. Google publishes Meridian and Meta Marketing Science publishes Robyn, both open source. Neither removes the need for clean data and someone who can judge whether the model's answers make sense.
What should a small shop do instead?
Track blended ROAS (all revenue ÷ all ad spend) every week, and when a big budget question comes up, run a pause or geographic test on one channel. That answers one question well, which is often all a small budget needs.