ROAS (return on ad spend)
ROAS (return on ad spend) is the revenue your ads brought in divided by what you spent on them: €4 of sales for every €1 of advertising is a ROAS of 4, or 400%. It measures revenue, not profit, so it only tells you whether ads pay once you compare it with your breakeven ROAS.
ROAS = revenue attributed to ads ÷ ad spend
Every ad platform reports it, which makes it the most common number in e-commerce advertising. It is also the number most often mistaken for profit.
How do you calculate ROAS?
Divide the revenue attributed to your ads by the ad spend for the same period and the same campaigns. Use revenue without VAT, and decide up front whether returns are taken out.
A home-goods shop runs a Google Shopping campaign for a month:
- Ad spend: €4,200
- Conversion value (without VAT): €15,960
- ROAS: €15,960 ÷ €4,200 = 3.80×, or 380% in Google's format
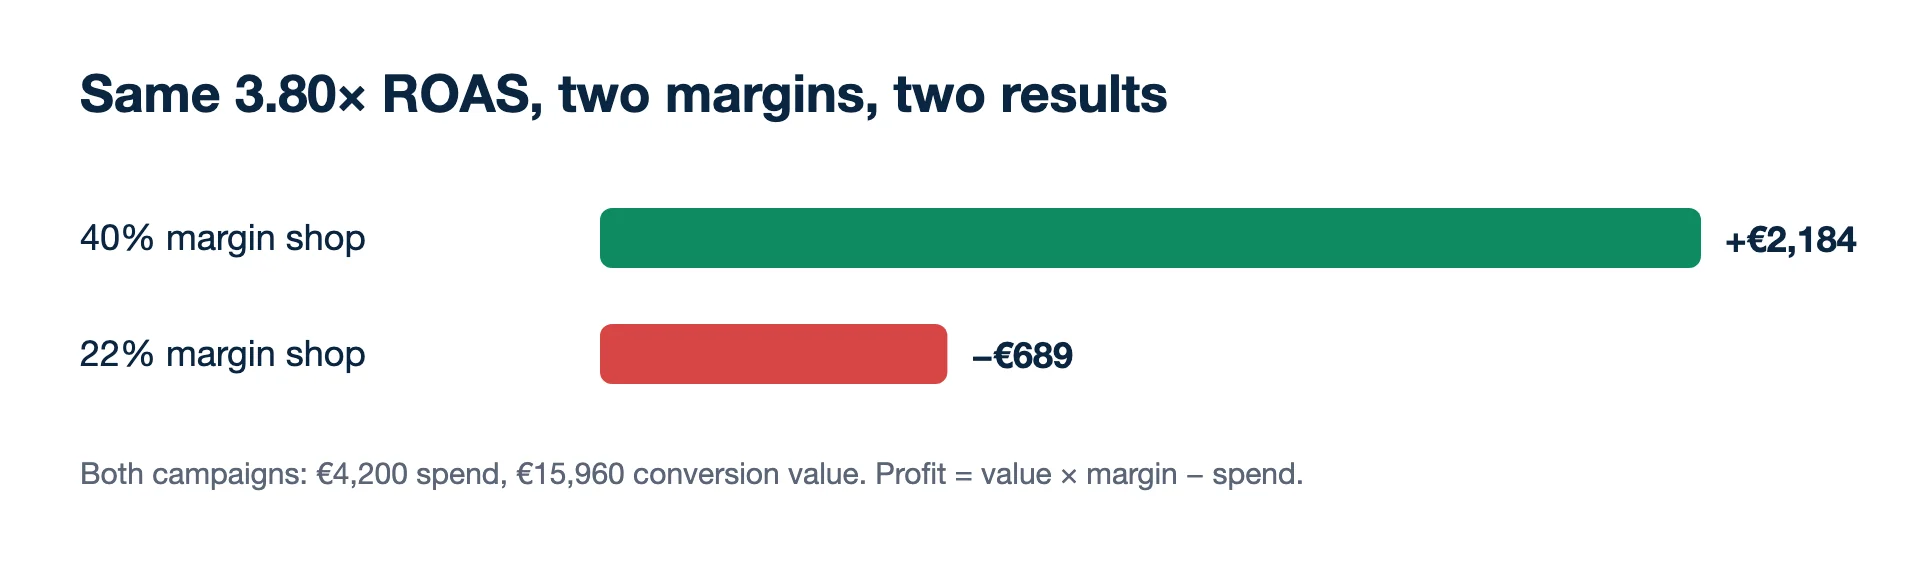
This shop keeps 40% of each order after goods, payment fees and delivery:
- What the orders left before ads: €15,960 × 0.40 = €6,384
- Minus ad spend: €6,384 − €4,200 = €2,184 profit from the campaign
- Breakeven ROAS at a 40% margin: 1 ÷ 0.40 = 2.50×
A second shop with the same 3.80× but a 22% margin is in a different position. Its orders leave €15,960 × 0.22 = €3,511, which is €689 less than the €4,200 it spent. Same ROAS, opposite result.
Is a ROAS of 3.8 good?
It is good only if it is above your breakeven ROAS, which is 1 ÷ contribution margin. At a 40% margin the floor is 2.50×, so 3.80× pays; at a 22% margin the floor is 4.55×, so the same 3.80× loses money. There is no universal good ROAS, only a good ROAS for your margin.
A second example: VAT and returns
A fashion shop's platform shows €12,100 of conversion value on €2,500 of spend, a ROAS of 4.84×. Two corrections change the picture:
- Take out 21% VAT: €12,100 ÷ 1.21 = €10,000, so ROAS is €10,000 ÷ €2,500 = 4.00×.
- Take out returns: a quarter of orders come back, so kept revenue is €10,000 × 0.75 = €7,500, and ROAS is €7,500 ÷ €2,500 = 3.00×.
The shop keeps 50% of kept revenue, so its breakeven is 2.00× and the campaign earns €7,500 × 0.50 − €2,500 = €1,250. Compared with 4.84× the real figure is much lower, but still profitable. Judged against the raw 4.84×, the shop would expect far more profit than it gets. The ROAS after returns calculator does these steps for you.
How Meta and Google report ROAS
Both platforms compute ROAS from the conversions they count themselves, and they count differently:
- Google Ads divides conversion value by cost. Its default click-through conversion window is 30 days, and Target ROAS is entered as a percentage (Google's example: $5 of sales per $1 of spend is 500%).
- Meta attributes purchases to ads within the ad set's attribution setting; the default for most conversion goals is 7-day click or 1-day view. Its ROAS goal is a decimal, so a 110% return is 1.100.
- Your shop sees every order, but cannot tell which ad, if any, led to it.
The same campaign therefore shows a different ROAS in each place, and the figures never agree. Neither is "the" ROAS. Use one source per decision, the same way every week, and judge the account as a whole on blended ROAS: all revenue ÷ all ad spend, which needs no attribution.
What ROAS is good for
ROAS is the number the bidding systems understand. Google's Target ROAS and Meta's ROAS goal both steer delivery toward a figure you give them. If that figure is wrong for your margin, the platform will hit it faithfully and you will still lose money, so set it from breakeven, not from habit.
It is also a quick alarm. If ROAS falls from 3.8 to 2.9 in a week while nothing else changed, conversion rate, order value or cost per click moved, and you know where to look.
Mistakes that make ROAS lie
- Treating ROAS as profit. A ROAS of 2 sounds like doubling the money. At a 45% margin it is a loss.
- Comparing campaigns with different jobs. Brand search and retargeting reach people already close to buying, so their ROAS is naturally higher than prospecting. That does not mean more budget there brings more sales.
- Adding up platform ROAS. Meta's and Google's revenue figures can both include the same order. Sum them and some sales are counted twice.
- Changing the attribution setting mid-month and comparing the ROAS before and after as if nothing changed.
Related terms
- POAS: the same idea with profit instead of revenue.
- Target ROAS: the number you give the bidder.
- MER: the account-wide view.
- Attribution window: why ROAS changes with the reporting setting.
- Google Ads Help: About Target ROAS bidding (checked 2026-11-19)
- Google Ads Help: About conversion windows (checked 2026-11-19)
- Meta Business Help Centre: About ROAS goal (checked 2026-11-19)
- Meta Business Help Centre: Differences between conversion optimisations in Meta Ads Manager (attribution settings; checked 2026-11-19)
Changes wait for you. Kunads proposes budget moves in 20% steps with the reasoning attached; nothing reaches Meta or Google until you press Approve.
See what it would change Begin a free trialROAS figures that confuse
Is ROAS the same as ROI?
No. ROAS compares revenue with ad spend only. ROI compares profit with the whole investment. A campaign can have a ROAS of 3 and a negative ROI once goods, fees and delivery are paid.
Why does Google show ROAS as a percentage and Meta as a decimal?
Google Ads takes Target ROAS as a percentage, so €5 of sales per €1 of ads is entered as 500%. Meta's ROAS goal is a decimal: a 110% return is entered as 1.100. Both describe the same ratio.
Can ROAS be below 1 and still be fine?
Only if you know the first order is followed by repeat orders that pay back the gap, and you have measured that in your own customer data. Otherwise a ROAS below 1 means the ads did not even return their own cost in revenue.