Profit tracking for Meta and Google ads
Kunads profit tracking shows what each Meta and Google campaign earned after the goods, fees and delivery behind its sales: revenue × your measured margin − ad spend, from your own shop orders or CRM won deals. It tells e-commerce brands, lead-gen businesses and agencies which ad spend makes money.
In short
- Profit per campaign = revenue × measured margin − ad spend; POAS = that gross profit ÷ ad spend.
- Blended ROAS (MER) against your breakeven line, day by day and month by month.
- Each platform's count next to the shop's, in both directions, without taking sides.
How is profit per campaign calculated?
Revenue × your measured margin − ad spend; gross profit ÷ ad spend gives POAS. Step by step:
- Connect outcomes. Shopify, WooCommerce or Magento orders, a custom shop by Google Sheet, CSV or API, or won deals from any CRM. Shopify starts with the last 60 days of orders.
- Measure the margin. The CFO agent works out what an average order keeps after goods, payment fees and delivery. One European food shop: €25.20 order, €13.57 kept, 53.8% contribution margin, breakeven at 1.86×.
- Apply it to every campaign. Each campaign's revenue × margin gives gross profit; minus ad spend gives profit; gross profit ÷ spend gives POAS. Below 1× POAS, the campaign costs more than it brings.
- Reconcile. The DATA agent puts Meta's count, Google's count and the shop's own record side by side.
- Read the whole account. Blended ROAS (all revenue ÷ all ad spend) needs no attribution. It is read against breakeven, with new-customer ROAS beside it.
Why the margin matters more than the ROAS: take a campaign that spent €1,000 and brought €4,000 of revenue in the shop's count, a 4× ROAS. At a 20% margin its gross profit is €800, its POAS 0.8× and its profit −€200: it lost money. At the food shop's 53.8% margin the same revenue keeps €2,152, a POAS of 2.15× and a profit of €1,152. Same ROAS, opposite verdicts, which is why no campaign is judged until the margin is known.
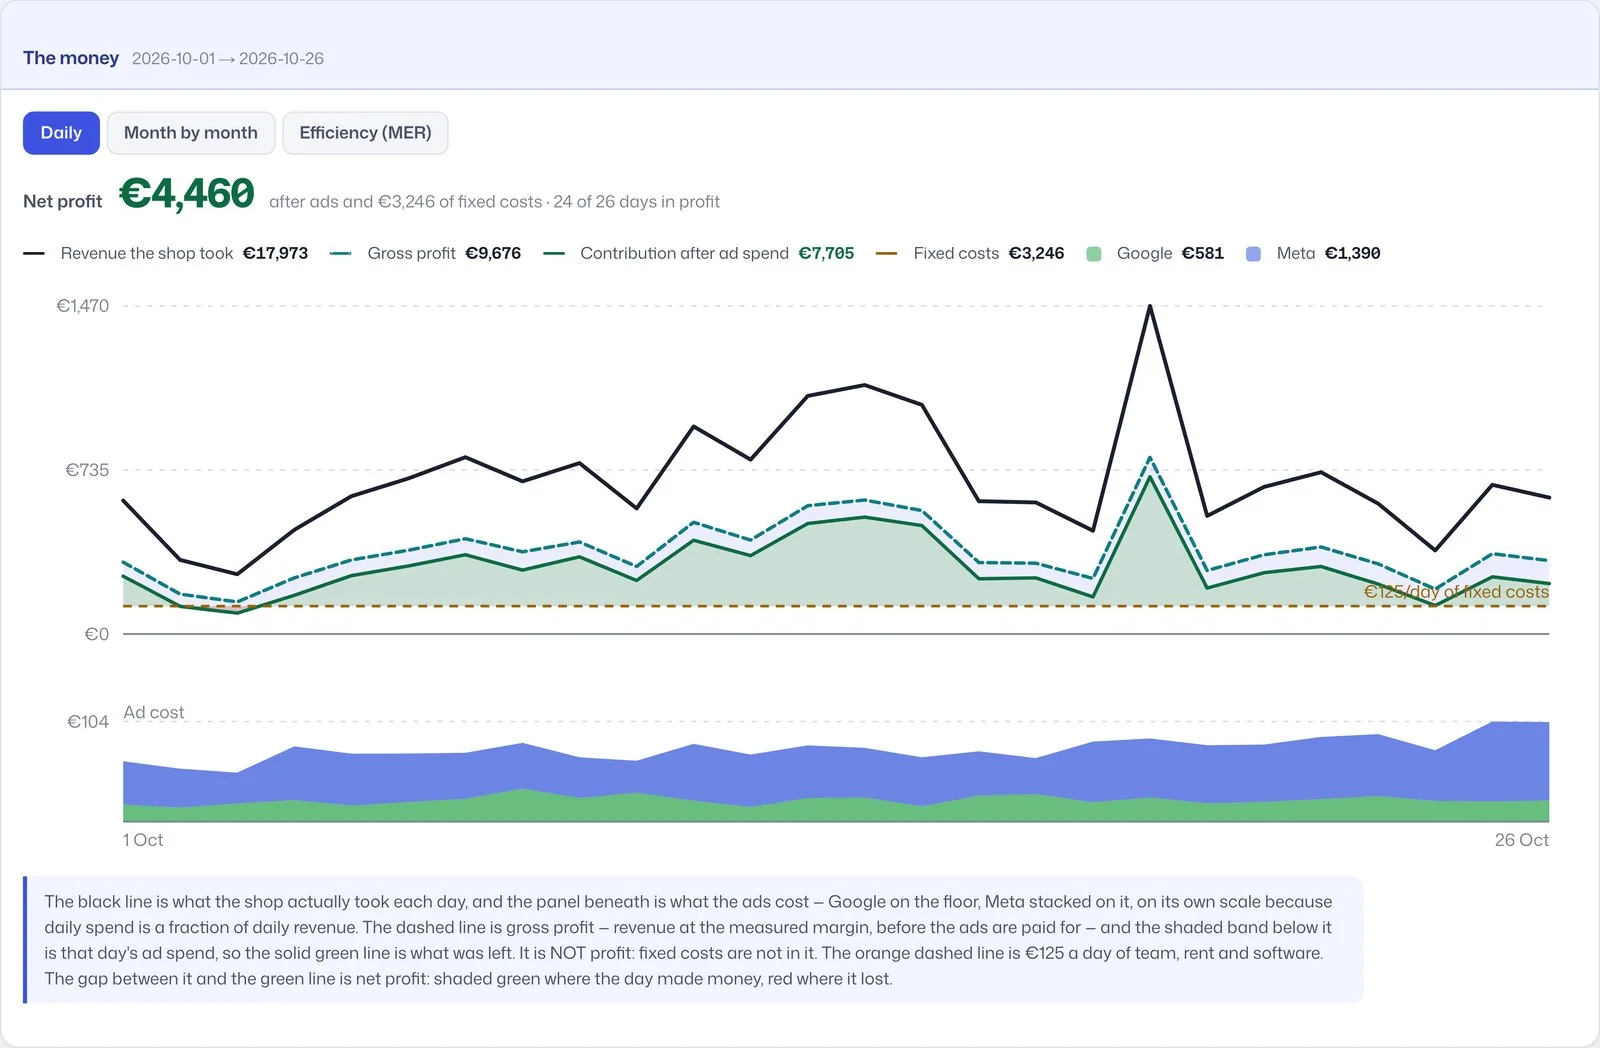
What you see
The money chart shows, each day, what the shop took, gross profit at the measured margin, and what was left after ad spend. Fixed costs (team, rent, software) appear as a daily line, so the gap between it and the contribution line is net profit, green on days that made money and red on days that lost. Below, ad cost per day is stacked by platform. Tabs switch to month by month and to efficiency.
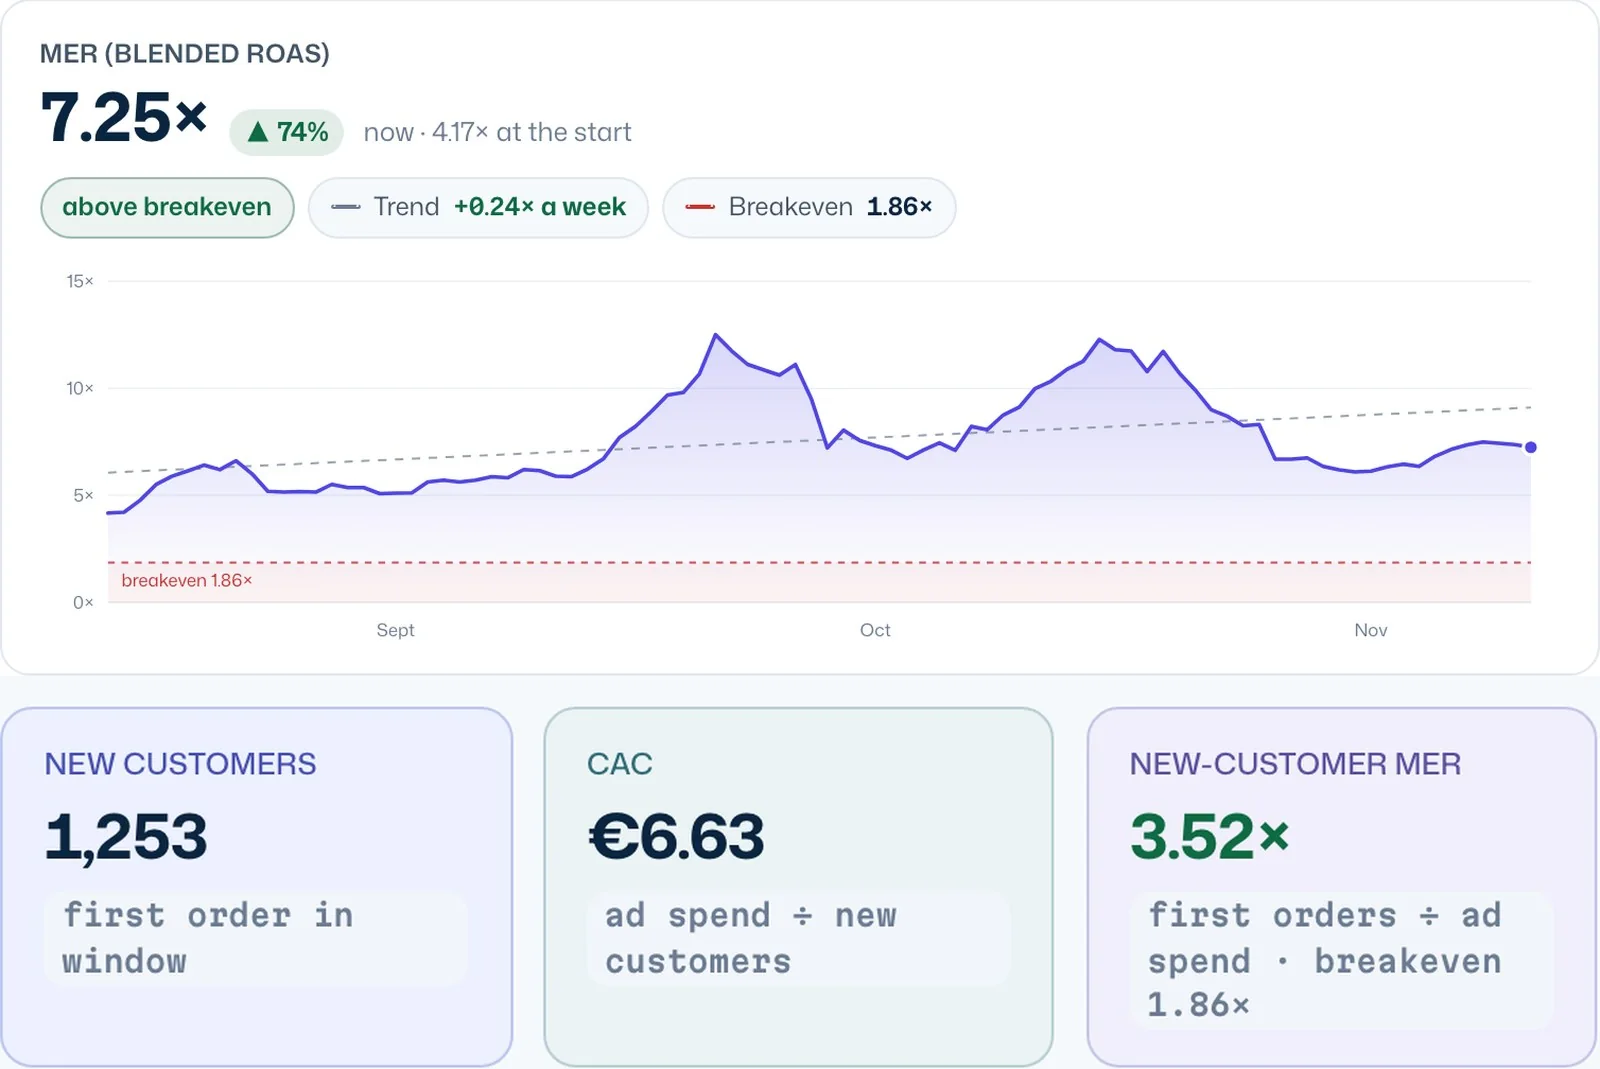
The efficiency view plots blended ROAS over time against the breakeven line, with the weekly trend. Cards below count new customers, CAC (ad spend ÷ new customers) and new-customer ROAS, which counts first orders only so repeat buyers do not make the ads look better than they are. The same question, what did this euro bring back after margin, is asked of every campaign, every ad and every search term.
Why do Meta, Google and the shop show different numbers?
Because each counts sales its own way: different attribution windows, view-through credit, blocked tracking, and the same order counted by two platforms. They never agree. Kunads shows each platform's count beside what the shop recorded and steers the account on blended ROAS. Meta opens on its default window (7-day click + 1-day view), with 7-day click and 1-day click a switch away. More on this in why Meta and Shopify numbers don't match.
Meta explains its counting in its attribution documentation: that is Meta's count, under Meta's rules, and it belongs beside the shop's record rather than in place of it. The shop's side is the order itself as the shop stores it (on Shopify, the Order object with its totals, refunds and discounts), which is why the shop's number is the one profit is worked out from.
Limits
- Give a profit verdict without a margin. If none is measured or entered, it says so.
- Build a multi-touch attribution model or MMM.
- Track TikTok, Microsoft or LinkedIn Ads spend; these are not built.
- Include VAT in revenue. Compare like with like: see the breakeven ROAS guide.
Who it is for
Shops with real cost of goods, where a 4× ROAS can still lose money; lead-gen businesses that measure won deals rather than form fills; and agencies that report profit to clients. If you only need the formula, the free POAS calculator does it without an account.
Related features
- Offline conversions: send real profit back to Meta and Google.
- Revenue and profit goals: plan the month from these numbers.
- AI media buyer: acts on the campaigns below breakeven.
- White-label client reporting: share profit with clients.
- Meta Business Help Center: About Facebook's attribution system (checked 2026-11-19)
- Shopify Dev Docs: GraphQL Admin API, Order object (checked 2026-11-19)
See it on your own campaigns. Kunads reads your Meta and Google ads and your shop's orders, read-only, and shows the result per campaign.
Run the free profit audit Start a 14-day trialShops, margins and fixed costs
Which shops does it read orders from?
Shopify, WooCommerce and Magento, and custom shops through a Google Sheet, CSV or API. Lead-gen businesses connect won deals from any CRM the same ways.
Does it include fixed costs?
The daily money chart can show fixed costs as a line, so you see net profit after them. Campaign verdicts use contribution after ad spend, because fixed costs do not change with one more order.