Contribution margin
Contribution margin is the share of an order's value left after every cost that comes with that order: goods, payment fees, delivery you pay, packaging and expected refunds. A €60 order that carries €31.54 of such costs has a contribution margin of 47.4%. It is the money each sale contributes toward ads, fixed costs and profit.
Contribution margin = (order value − variable costs per order) ÷ order value
The test for whether a cost belongs is one question: does it go up when one more order comes in? If yes, it is variable and goes in. Rent, salaries, software and the accountant do not change with one more order, so they stay out. VAT stays out too, on both sides.
Worked example: a €60 order, line by line
A homeware shop's average order is €60.00 without VAT.
| Variable cost | Per order | Note |
|---|---|---|
| Cost of goods | €21.00 | Purchase price of the items |
| Payment fee | €1.14 | 1.9% of €60.00 |
| Delivery the shop pays | €5.50 | Average across free and paid shipping |
| Packaging and pick-and-pack | €0.90 | Box, filler, warehouse fee |
| Expected refunds and returns | €3.00 | Measured from last year's returns |
| Total | €31.54 |
- Contribution per order: €60.00 − €31.54 = €28.46
- Contribution margin: €28.46 ÷ €60.00 = 47.4%
- Breakeven ROAS: €60.00 ÷ €28.46 = 2.11×
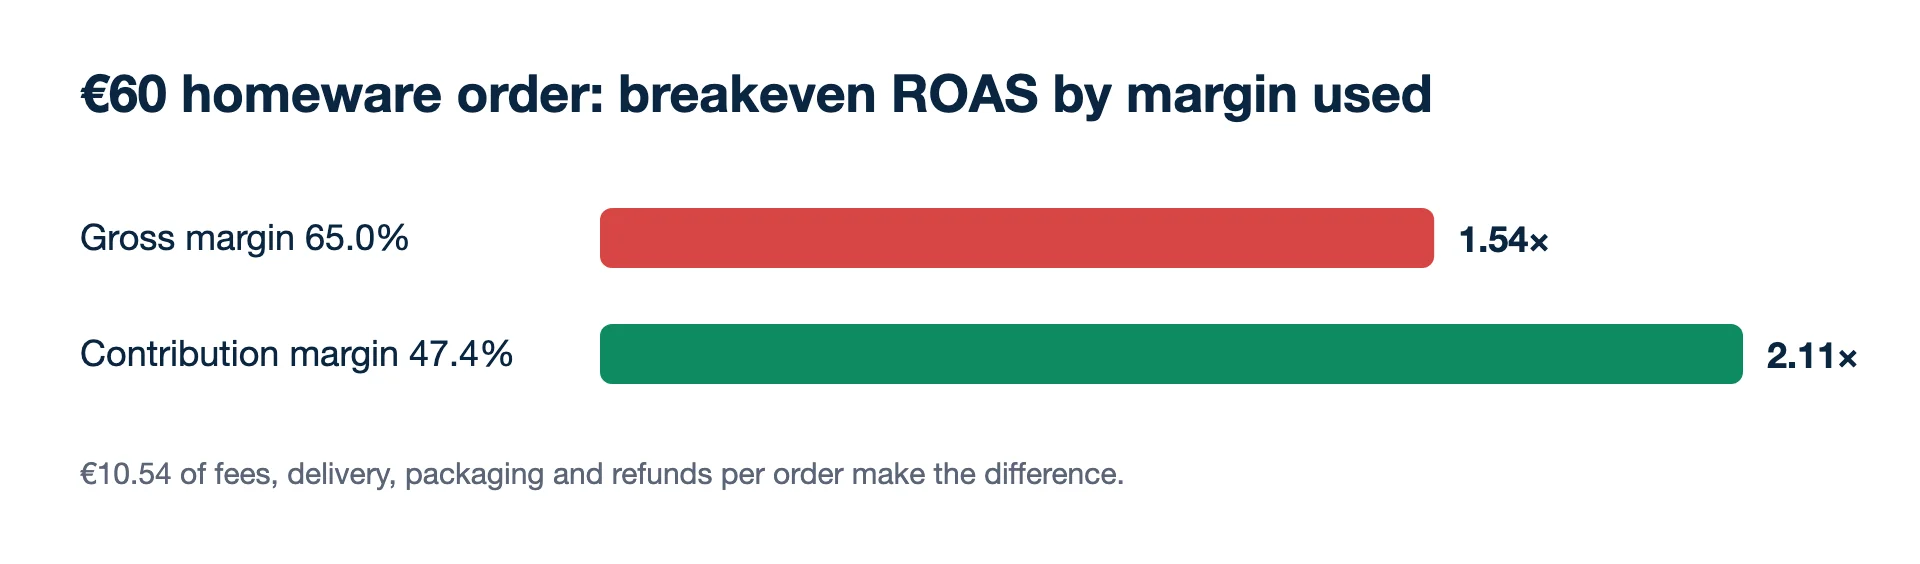
- Gross margin, for comparison: (€60.00 − €21.00) ÷ €60.00 = 65.0%, which would suggest a breakeven of only 1.54×
The €10.54 of non-product costs move the breakeven from 1.54× to 2.11×. A campaign running at 1.8× looks profitable on gross margin and is losing money on contribution.
What is the difference between contribution margin and gross margin?
Gross margin subtracts only the cost of goods; contribution margin also subtracts every other cost that comes with the order, so it is always lower. In the example the gap is 65.0% against 47.4%. See gross margin for when the higher number is the right one to use.
Second example: a fashion order with returns
Returns change the shape of the sum, not just one line. A fashion shop's average order is €80.00 without VAT, its goods cost €28.00, and 25% of orders come back. Per order placed:
- Revenue kept after refunds: €80.00 × 0.75 = €60.00
- Cost of goods on the orders kept (returned items go back to stock): €28.00 × 0.75 = €21.00
- Delivery out, paid on every order: €6.00
- Return handling and postage, €7.00 on one order in four: €1.75
- Payment fee on the original charge (1.9%): €1.52
- Packaging: €1.20
- Contribution: €60.00 − €21.00 − €6.00 − €1.75 − €1.52 − €1.20 = €28.53
Against the €80.00 the ad platforms record at checkout, that is a contribution margin of 35.7% and a breakeven ROAS of 80.00 ÷ 28.53 = 2.80×. The catalogue view, (80 − 28) ÷ 80 = 65%, would put breakeven at 1.54×. A campaign at 2.2× looks comfortable on the catalogue figure and loses money on every order.
Should ad spend be in contribution margin?
No, not when you use it to set a breakeven ROAS, because ad spend is the thing you compare it against. Some reports add a "contribution after ads" line (contribution minus ad spend); that is a later, different number, useful for the month's result.
Every profit number rests on it
Every profit number in advertising rests on it. Breakeven ROAS is 1 ÷ contribution margin. POAS is ROAS × contribution margin. The highest CPA you can pay is contribution per order. Get the margin wrong and every one of those is wrong in the same direction, usually toward spending too much.
Per order, per product, per campaign
The example above is an average order. The same calculation works at other levels, and the right one depends on the decision. For a single product, use its own cost and its share of delivery. For a campaign, use the margin of what that campaign actually sold: a Shopping campaign full of clearance items can run at half the shop's average margin. For the whole account, the average is fine, and it is what you compare blended ROAS against. Recalculate whenever a big cost moves, such as a carrier price rise or a new payment provider.
How Shopify and Google Ads report margin
Neither reports contribution margin as defined here. Shopify's gross margin report calculates (net sales − cost) ÷ net sales, using the cost per item you record and net sales after discounts and refunds; its profit-by-order reports add shipping charges and the shipping costs your store pays, but payment fees are not mentioned. Google Ads can report gross profit through conversions with cart data, using the cost of goods from your Merchant Center feed, which is gross profit, not contribution. Use these as inputs and add the remaining lines yourself.
Where the margin goes wrong
- Taking the margin from the product catalogue. That is gross margin. It forgets delivery, fees and returns.
- One margin for the whole shop. If own-brand products keep 60% and resold brands 25%, calculate per category, or campaigns selling the low-margin side will look better than they are.
- Discount codes left out. Use the order value after discounts, not list price.
- Loading fixed costs per order. They do matter, but they are paid from total contribution, not from each order.
The contribution margin calculator walks through each line for your own shop.
- Shopify Help Center: Profit reports (gross margin formula, shipping in profit by order) (checked 2026-11-19)
- Google Ads Help: About conversions with cart data (revenue and gross profit) (checked 2026-11-19)
- Google Merchant Center Help: Cost of goods sold (cost_of_goods_sold) (checked 2026-11-19)
Numbers from your shop, not from the ad platforms. Connect Meta, Google and Shopify, WooCommerce or Magento and see what each campaign kept.
Get my profit audit Open a free workspaceContribution margin and VAT
Is VAT a cost in contribution margin?
No. Remove VAT from both the order value and the costs. It is collected for the tax office.