AOV (average order value)
AOV (average order value) is the average amount a customer spends per order: revenue in a period divided by the number of orders in it. A shop that took €29,400 from 700 orders has an AOV of €42. It is the bridge between what one sale costs you in ads and what it brings back.
AOV = revenue ÷ number of orders
Shopify's analytics define it a little more precisely: (gross sales − discounts) ÷ orders, describing it as the average value of orders placed, excluding post-order adjustments such as later edits or returns. Other reports in the same admin can include tax and shipping, so two AOV figures from one shop can differ. Pick one definition for ad work and keep it.
Worked example: one week of orders
- Gross sales (before discounts, without VAT): €31,850
- Discounts used: €2,450
- Orders: 700
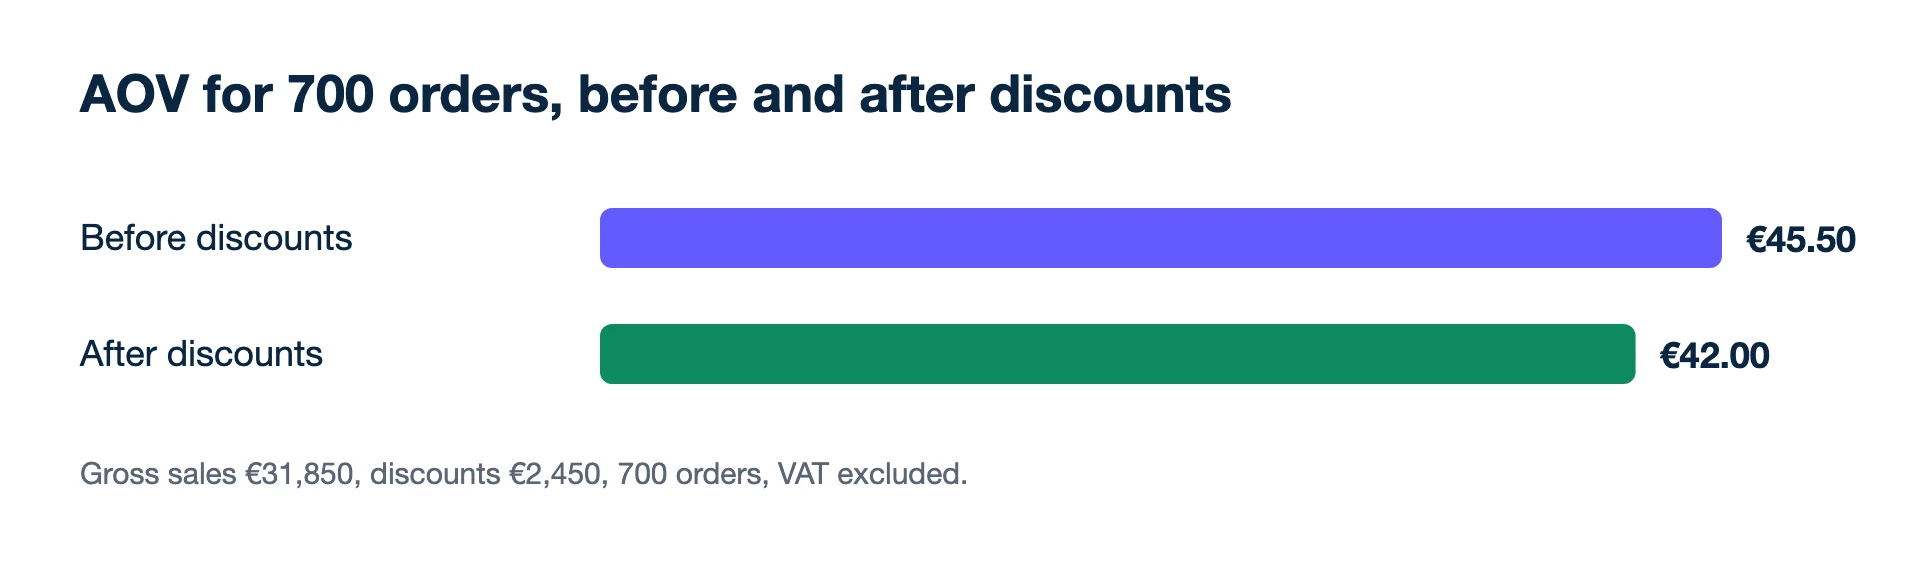
- AOV: (€31,850 − €2,450) ÷ 700 = €29,400 ÷ 700 = €42.00
Without the discount line, AOV would read €45.50 (31,850 ÷ 700). That €3.50 gap is the difference between list price and what customers actually paid, and it is the one that matters for margin.
How does AOV connect CPA and ROAS?
ROAS is AOV divided by CPA, so AOV ties the two most used ad numbers together, along with the most you can pay for a sale:
- ROAS = AOV ÷ CPA. With a €42 AOV and a €15 cost per purchase, ROAS is 42 ÷ 15 = 2.8.
- Highest affordable CPA = AOV × contribution margin. At a 40% margin, a €42 order can carry at most €16.80 of ad cost.
- Breakeven ROAS = AOV ÷ contribution per order. €42 ÷ €16.80 = 2.5.
This is why raising AOV is often the cheapest way to improve ad results. If bundles or a free-delivery threshold lift AOV from €42 to €48 while CPA stays at €15, ROAS goes from 2.8 to 3.2 without touching a single campaign. Check that the margin holds: a bundle discount or extra free deliveries can eat part of the gain. The breakeven ROAS calculator starts from your AOV and costs.
Why can AOV describe almost no real customer?
Because AOV is a mean, and a few large orders pull it up. Take 20 orders in a day: 19 ordinary baskets that add up to €570 (€30 each on average) and one wholesale order of €470. Revenue is €1,040, so AOV is €1,040 ÷ 20 = €52. The median order is about €30. Set a target CPA from €52 and every prospecting campaign will look as if it is overpaying for customers who actually spend €30. If your order sizes are spread out, look at the median as well, and consider leaving one-off bulk orders out of the number you use for ad targets.
How Shopify, GA4 and the ad platforms report it
- Shopify calculates (gross sales − discounts) ÷ orders and ignores later edits and returns, so AOV for last month does not drop when a customer sends something back.
- GA4 has an "Average purchase revenue" metric, and its "Purchase revenue" is defined as revenue from purchases minus refunds. A GA4 average can therefore come out lower than Shopify's for the same weeks, and GA4 only sees orders its tag recorded.
- Meta and Google Ads do not report the shop's AOV. Dividing a campaign's conversion value by its purchases gives the average value of the purchases that platform counted, in its own way and window. Take AOV from the shop.
AOV errors in ad maths
- Including VAT and shipping. Neither is revenue you keep. Leave them out, or your breakeven ROAS comes out too low.
- Chasing AOV alone. A higher average from fewer, bigger orders can mean less total revenue. Watch orders and AOV together.
- Using a stale AOV. AOV drifts with price changes and the product mix. Recalculate it from the last 90 days before you set a target CPA or tROAS, not from last year's report.
- Comparing periods with different promotions. A sale week lowers AOV by design. Compare it with last year's sale week, not the week before.
See also CPA, ROAS, contribution margin and LTV.
- Shopify Help Center: Analytics fields (Average order value) (checked 2026-11-19)
- Google Analytics Help: Analytics dimensions and metrics (Average purchase revenue, Purchase revenue) (checked 2026-11-19)
See it on your own campaigns. Kunads reads your Meta and Google ads and your shop's orders, read-only, and shows the result per campaign.
Run the free profit audit Start a 14-day trialAOV details that trip people up
How do I calculate average order value?
Divide revenue by the number of orders in the same period. Shopify's analytics use (gross sales − discounts) ÷ orders, leaving out edits and returns made after the order.
Does AOV include shipping and VAT?
It depends on the report. Shopify's main analytics field excludes them; some dashboards include them. For ad maths, use the value without VAT and without shipping the customer paid, and say which you used.
Should I use a different AOV per campaign?
Where you can, yes. Retargeting and brand campaigns often bring larger baskets than prospecting, so one shop-wide AOV makes some campaigns look better and others worse than they are.