LTV:CAC ratio
The LTV:CAC ratio is a customer's lifetime value divided by what it cost to acquire them. Use contribution profit, not revenue, for LTV, over a period you have actually observed. A ratio of 3:1 means each new customer brings back three times their acquisition cost over that period; below 1:1, customers never pay for themselves.
LTV:CAC = contribution LTV over a period ÷ customer acquisition cost
Both halves need care. LTV should be what a customer leaves after goods, delivery and fees, over a period you have observed. CAC should count only new customers. Get either wrong and the ratio looks better than the business is.
Worked example: a coffee subscription
A coffee roaster sells a monthly bag at €18 without VAT. Each delivered bag leaves €8 after beans, roasting, packaging, postage and fees.
- Retention: the average subscriber stays 12 months before cancelling (measured on last year's sign-ups).
- 12-month contribution LTV: 12 × €8 = €96.
- CAC: last quarter the roaster spent €9,600 on Meta and Google and gained 300 new subscribers. €9,600 ÷ 300 = €32.
- Ratio: €96 ÷ €32 = 3.0:1.
- Payback: €32 ÷ €8 per month = 4 months before a subscriber has paid back their acquisition cost.
Now the revenue version: 12 × €18 = €216 against €32 is 6.75:1. Same business, more than twice the ratio. This is the most common way LTV:CAC is made to look healthy.
The ratio on the next euro is lower than the average
The roaster raises quarterly spend by half, from €9,600 to €14,400, and gains 390 new subscribers instead of 300. The average CAC is now €14,400 ÷ 390 = €36.92, and the average ratio €96 ÷ €36.92 = 2.6:1. That still looks fine. But the extra €4,800 bought only 90 extra subscribers: €4,800 ÷ 90 = €53.33 each, so the ratio on those customers is €96 ÷ €53.33 = 1.8:1.
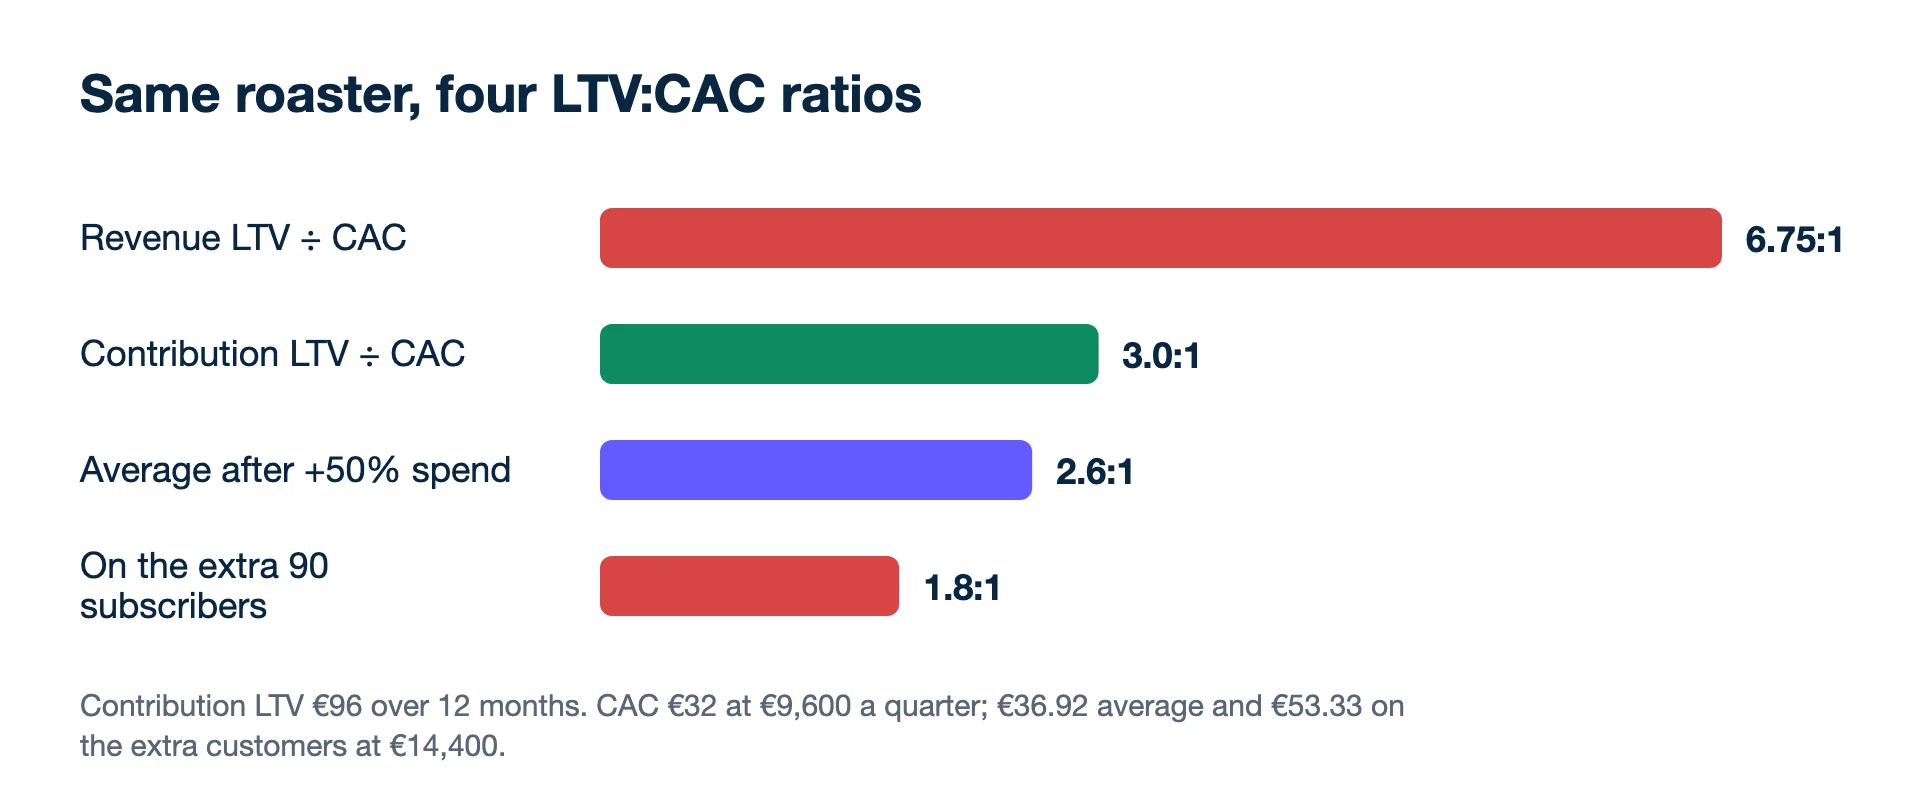
The average hides the decline because it still includes the cheap first 300. Spending decisions belong to the marginal ratio. If the roaster's floor is 2:1, the last step went too far, even though the account-wide ratio is above 2.6.
How do you calculate LTV:CAC for a shop without subscriptions?
Count the orders a typical new customer actually places in a fixed window, usually 12 months, and multiply by the contribution per order. Take a skincare shop with an average order of €50 without VAT, of which €20 is left after goods, delivery and fees. Customers acquired a year ago placed 2.4 orders on average in their first 12 months.
- 12-month contribution LTV: 2.4 × €20 = €48.
- CAC: €6,000 of ad spend brought 200 first-time buyers, so €30 each.
- Ratio: €48 ÷ €30 = 1.6:1.
- Payback: the first order leaves €20, less than the €30 CAC; the customer has paid back only on the second order, if they place one.
Here the ratio is above 1 but thin, and it depends entirely on repeat purchases. If many customers buy once and never return, the 2.4 average comes from a minority, and the cohort's typical customer loses money. Look at the share who reorder, not just the mean.
What is a good LTV:CAC ratio?
A common rule of thumb is 3:1 or better, but it is a convention from subscription businesses, not a law. It assumes the remaining two thirds of the value pays for staff, product and overheads. Two things matter more than the exact ratio:
- Payback time. 3:1 with an 18-month payback can sink a shop with little cash; 2:1 with a one-month payback can fund fast growth. Look at the payback period next to the ratio.
- Fixed costs. A team of 20 needs more margin from each customer than a team of 2.
Can Meta and Google bid on lifetime value?
Partly, and only from data you give them. Google Ads customer lifecycle goals let a Target ROAS or Maximise conversion value campaign bid higher for new customers than for existing ones (New Customer Value), with a further tier for high-value new customers; you define existing customers with your own first-party data. Meta's Conversions API has a field for the predicted lifetime value of a conversion event, which you calculate and send. Both rely on your own figures; neither works out your LTV:CAC ratio for you. GA4 offers a nearer-term figure, predicted revenue over the next 28 days, once a property has enough purchase data to qualify.
Errors that flatter the ratio
- Revenue LTV. Shown above: it can double or triple the ratio.
- Lifetime by formula. An LTV that assumes customers stay for years you have not yet seen is a forecast. Use observed months.
- Blended CAC from all orders. Dividing spend by all buyers, new and returning, makes CAC too low.
- Ignoring the time lag. Spend this month buys customers whose value arrives over the next year. The ratio does not show cash flow; payback does.
The LTV:CAC calculator works out the ratio and the payback from your own order value, margin, repeat rate and CAC.
Related terms
- Google Ads Help: About customer lifecycle goals (checked 2026-11-19)
- Meta for Developers: Conversions API custom data parameters (predicted_ltv) (checked 2026-11-19)
- Analytics Help: [GA4] Predictive metrics (checked 2026-11-19)
Lead generation? Send won deals from your CRM and Kunads ranks campaigns by what the leads were worth, not by how many came in.
Check my lead campaigns Start free for 14 daysDoubts about the 3:1 rule
Is a very high LTV:CAC ratio good?
Not always. A ratio of 8:1 can mean you are underspending and leaving profitable customers to competitors. Test spending more and watch whether the ratio on the extra customers stays above your floor.
Should the ratio be worked out per channel?
Where you can, yes. Customers won through a deep discount or a giveaway often buy less often afterwards, so one account-wide ratio can hide a channel that never pays back.