Reach
Reach is the number of distinct accounts that saw your ad at least once in a period. Meta counts it in Meta Accounts and calculates it from sampled data, so it is an estimate. Impressions count every showing, including repeats to the same account; impressions ÷ reach gives frequency.
Reach = number of unique accounts that saw the ad at least once
Frequency = impressions ÷ reach
Cost per 1,000 accounts reached = spend ÷ reach × 1,000
How Meta defines it
Meta describes reach as a measure of how many Meta Accounts were exposed to your message, and says it is affected by your bid, budget and audience targeting. It sits among Meta's estimated metrics, which are produced by sampling or modelling, give directional insight and may change as more data comes in. Cost per 1,000 Meta Accounts reached is the amount spent ÷ reach × 1,000, measured across Facebook, Instagram, Messenger and Audience Network.
Two practical consequences. Small numbers are loose: a reach of 1,200 against 1,350 is not a real difference. And an account is not a person: one person with unlinked accounts can be counted more than once, while a shared device blurs it the other way.
Why doesn't reach add up across ad sets?
Because the same account can be reached by several ad sets but is counted once in the campaign total. A bakery chain runs a local awareness campaign with three ad sets for two weeks:
| Ad set | Spend | Reach |
|---|---|---|
| Within 5 km of shops, 25–44 | €340 | 30,000 |
| Within 5 km of shops, 45–65 | €290 | 25,000 |
| Website visitors, last 60 days | €240 | 20,000 |
| Sum of rows | €870 | 75,000 |
| Campaign total, as reported | €870 | 58,000 |
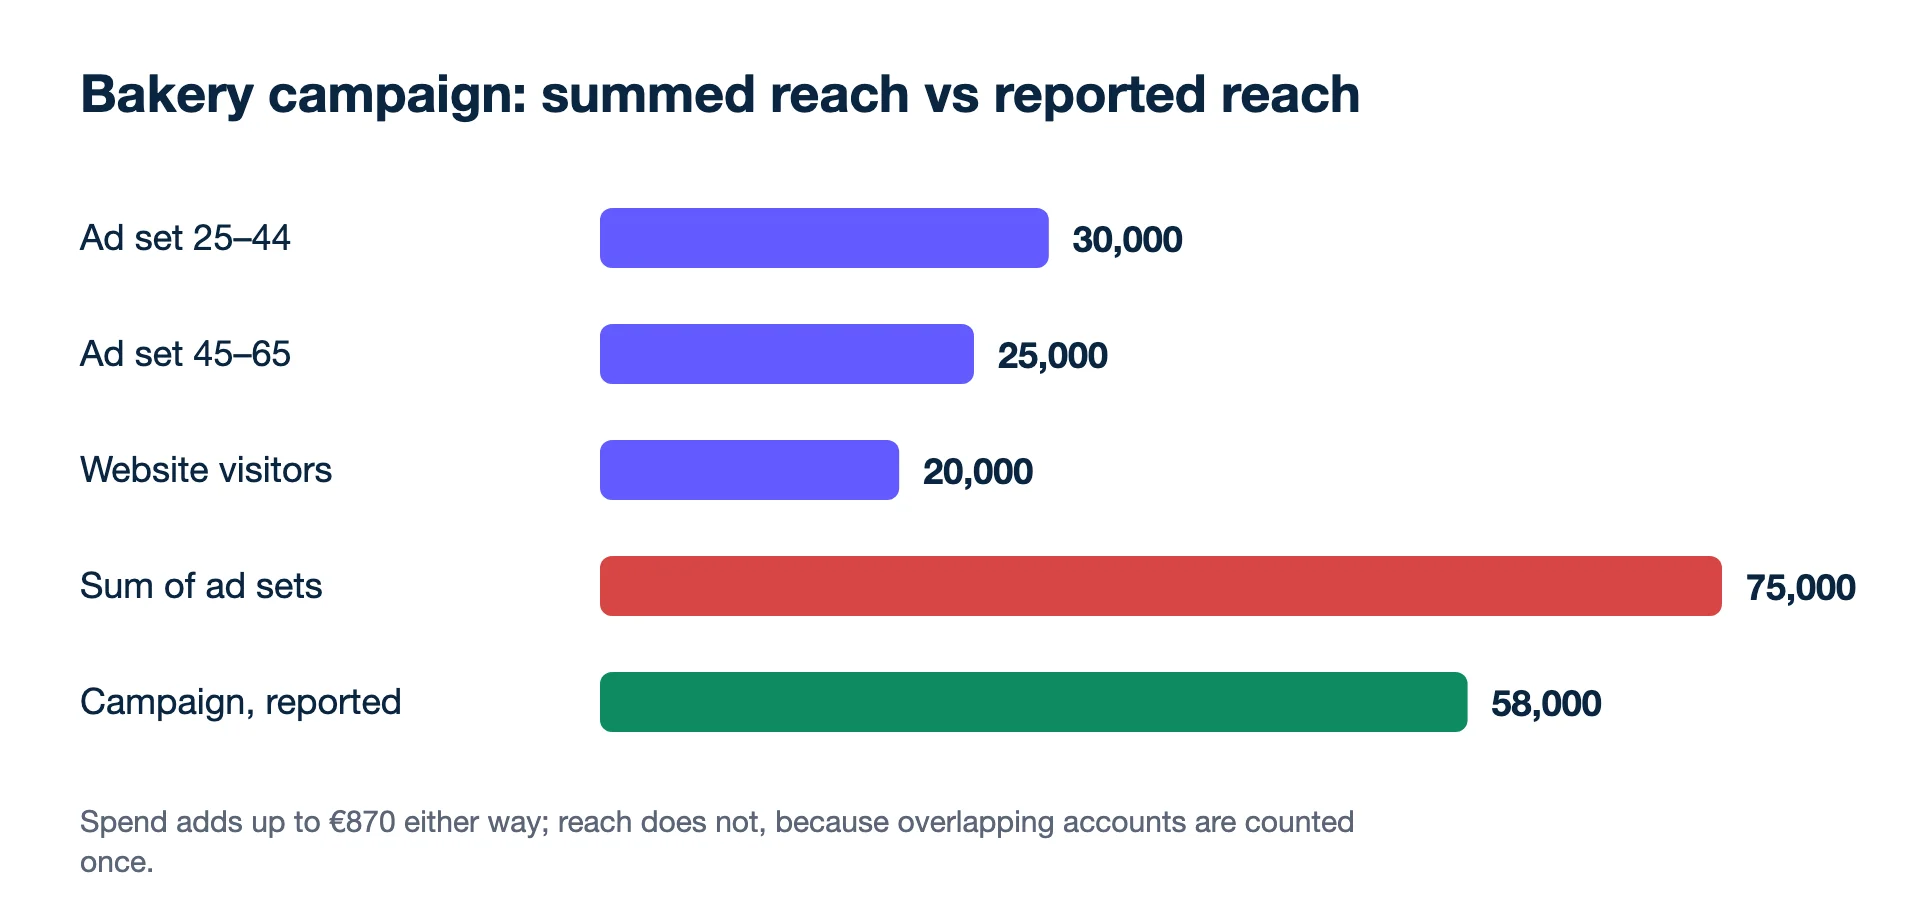
Spend adds up. Reach does not: many website visitors also live within 5 km and fall into one of the age groups, so they appear in two ad sets but once in the campaign. The campaign reached 58,000 accounts, not 75,000.
- Cost per 1,000 accounts reached: €870 ÷ 58,000 × 1,000 = €15.00
- With 145,000 impressions, frequency is 145,000 ÷ 58,000 = 2.5, and CPM is €870 ÷ 145,000 × 1,000 = €6.00
Using the summed 75,000 instead would put cost per 1,000 reached at €11.60 and frequency at 1.9: the campaign would look cheaper and less repetitive than it was.
The same trap over time
A clothing shop pulls weekly reach for a four-week prospecting campaign: 22,000, 20,000, 19,000 and 18,000. The weeks sum to 79,000. Reach for the whole month, pulled as one period, is 46,000, because many accounts saw the ads in more than one week. With 138,000 impressions in the month, monthly frequency is 138,000 ÷ 46,000 = 3.0, not the 1.7 the summed figure suggests (138,000 ÷ 79,000).
Falling weekly reach at steady spend, as here, usually means the campaign is running out of new accounts in its audience and showing the same ads to the same people. That is the early sign of ad fatigue. Always pull reach for the exact period and level you want to report, rather than adding rows in a spreadsheet.
How does Google count reach?
Google reports unique users, "the number of unique users (not cookies) who saw an ad", from statistical models that de-duplicate people across browsers, devices, formats and networks, combined with inputs such as census data and surveys. Its models include co-viewing on connected TVs, so several people watching one screen can count. Display, Demand Gen, Video and App campaigns report reach and frequency. Most of these metrics are available only for date ranges of 92 days or less, frequency distribution for 31 days or less, and reach data older than three years is not kept.
So Meta counts accounts from sampled data and Google models people. Never add Meta reach to Google reach to get "total people reached": the overlap between the two is unknown and the units differ.
Using reach well
- Awareness campaigns: reach is the result. Track cost per 1,000 reached and frequency together.
- Conversion campaigns: reach explains cost. Cheap reach often comes from people unlikely to buy, so judge on cost per result and read reach alongside frequency and CPM.
- Retargeting: a small audience caps reach. If 20,000 website visitors make up the ad set and 18,000 have already been reached, more budget mostly buys frequency, not new accounts. Raise the budget there only when the audience itself grows.
- Competitor estimates: a competitor's visible reach × an assumed frequency × your own CPM gives a rough spend. For example, 200,000 accounts × 2.5 = 500,000 impressions; at a CPM between €5 and €8 that is €2,500 to €4,000. It is a range, not a figure, and Kunads shows it as a range in competitor ad tracking.
Related terms
- Meta Business Help Centre: About reach metrics (checked 2026-11-19)
- Meta Business Help Centre: Estimated metrics (checked 2026-11-19)
- Meta Business Help Centre: Cost per 1,000 Meta Accounts reached (checked 2026-11-19)
- Google Ads Help: Measuring reach and frequency (checked 2026-11-19)
Lead generation? Send won deals from your CRM and Kunads ranks campaigns by what the leads were worth, not by how many came in.
Check my lead campaigns Start free for 14 days