How do I find the campaigns that lose money?
To find money-losing campaigns, work out each campaign's profit in euros: revenue credited × contribution margin − ad spend, over a period with enough conversions, on one fixed attribution setting. Sort by it. The ones below zero lose money on the first order; size the loss, then decide whether to cut, fix or keep each one.
How do I work out profit per campaign?
Multiply the conversion value each campaign is credited with by your margin, then subtract its spend. In order:
- Know your margin. What an average order keeps after goods, fees, delivery and refunds, as a share of order value. Use per-category margins if they differ. See contribution margin.
- Pick one attribution setting per platform and keep it. On Meta, for example, the default 7-day click + 1-day view or 7-day click only, not a mix.
- Check what the value means. A platform's conversion value is whatever your tracking sends it: with or without VAT, with or without shipping. Strip VAT out, or the margin maths is wrong from the start.
- Export campaigns with spend and conversion value for 30–90 days.
- Profit per campaign = value × margin − spend. Or compare ROAS with breakeven ROAS (1 ÷ margin); below breakeven means a loss.
- Check the data. Fewer than about 20–30 conversions and the result may be chance; mark it "too early", not "losing".
- Check the whole. Blended ROAS from the shop tells you whether the account pays overall.
Worked example: a shop with five campaigns
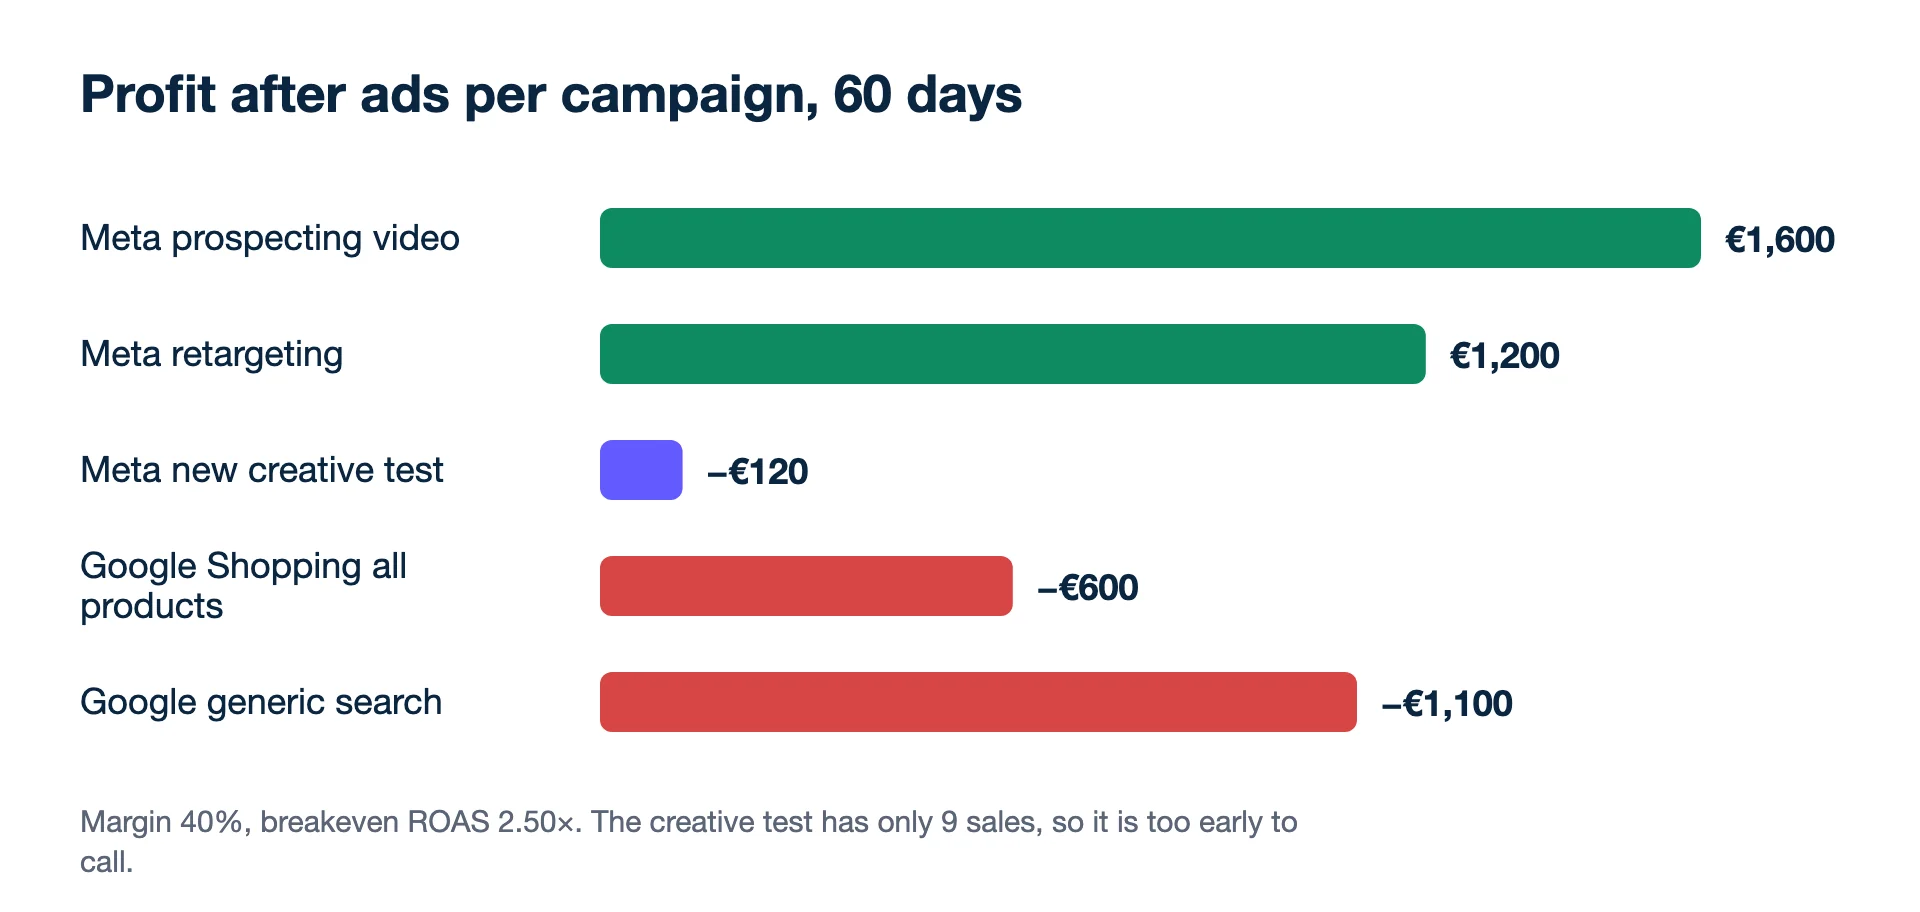
Margin 40%, so breakeven ROAS 2.50×. Last 60 days:
| Campaign | Spend | Value | ROAS | Profit after ads | Verdict |
|---|---|---|---|---|---|
| Meta prospecting video | €4,000 | €14,000 | 3.50× | €1,600 | Keep |
| Google Shopping all products | €3,000 | €6,000 | 2.00× | −€600 | Fix |
| Meta retargeting | €1,500 | €6,750 | 4.50× | €1,200 | Keep, check overlap |
| Google generic search | €2,500 | €3,500 | 1.40× | −€1,100 | Cut or rebuild |
| Meta new creative test | €300 | €450 | 1.50× | −€120 | Too early (9 sales) |
Profit check, first row: €14,000 × 0.40 = €5,600 − €4,000 = €1,600. The two clear losers cost €1,700 over 60 days. Run any row through the POAS calculator; a POAS below 1 is a loss.
Second example: a lead-gen account
For leads, replace revenue with the gross profit of won deals from the CRM, because a lead that never buys earns nothing. Say a won deal keeps €1,200 for the business:
- Meta lead form: €2,000 spend, 80 leads, 4 won. 4 × €1,200 = €4,800 − €2,000 = €2,800 profit.
- Google search: €1,800 spend, 30 leads, 1 won. €1,200 − €1,800 = −€600.
On cost per lead, Google looks worse (€60 against €25) and Meta's form looks like the winner. With one won deal, though, Google's result is too thin to call: one more win would put it at +€600. Mark it "too early" and keep counting won deals before you cut.
What should I do with each losing campaign?
Choose between a smaller budget, a structural fix, a pause or a deliberate keep, depending on how far below breakeven it sits:
- Cut the budget first, in a step of about 20%, when a campaign is close to breakeven. Smaller budgets often buy only the cheapest, best auctions.
- Fix the structure when one part drags the rest: split low-margin products out of Shopping, add negative keywords to search, exclude placements.
- Pause when it has enough data, sits far below breakeven and a smaller budget has not helped.
- Keep on purpose only if it brings new customers you have measured buying again; write that reason down and review it monthly.
How often should I check?
Check the full list monthly and the biggest spenders weekly. A campaign that slipped below breakeven last week is not yet a loser; one that has sat there for four weeks with plenty of sales is. Write down the decision and the date, so next month you can see whether the cut or fix worked.
Where this method misleads
Retargeting and brand search often look the best and cause the least, because they reach people who would buy anyway; a holdout test shows how much they add. Campaigns with different margins need different floors; a shop-wide margin can hide a loser selling only low-margin items. And Meta and Google each count conversions in their own way, and one order can appear in both, so campaign profits across platforms do not add up to the shop's profit; check the total against blended ROAS. Kunads does this sum per campaign from your measured margin, sizes each loss in euros and proposes a fix that a person approves. See also why ROAS drops.
- Example figures: illustrative.
- Meta Business Help Centre: How to compare attribution settings in Meta Ads Manager (checked 2026-11-19)
- Google Ads Help: About conversion values (checked 2026-11-19)
- Meta Business Help Centre: About conversion count differences between Meta Ads reporting and third-party reporting tools (checked 2026-11-19)
Breakeven, per campaign. Give Kunads your margin once; it marks which Meta and Google campaigns sit below it and by how many euros.
Find my losing campaigns Try it for 14 daysCut, fix or keep: the hard calls
Should I pause every campaign below breakeven?
Not always. Check whether it brings new customers who buy again, whether it has enough data to judge, and whether a smaller budget would bring it above breakeven. Brand search and retargeting deserve a stricter bar, not a looser one.
How long a period should I look at?
Long enough for at least 20–30 conversions per campaign, often 30 to 90 days. Fewer than that and the result can be chance.