White-label reporting
White-label reporting means the reports and dashboards an agency sends clients carry the agency's own logo, colours and often its own web address, not the brand of the software behind them. The client sees "Your Agency report", not "Report by ToolName". It keeps the relationship with the agency; the content still decides whether the report is any good.
What gets branded
- Logo and colours on the report, the dashboard and the emails.
- A custom domain, such as reports.youragency.com, usually set up with a DNS record pointing to the tool.
- Sender name and address on scheduled report emails.
- The login page of the client portal.
Free tools cover part of this. In Looker Studio, a theme sets the style of charts, tables, background and text, and you can generate a custom theme from the colours of an image such as the agency's logo. That gives a branded look, but the report still lives on Looker Studio's own address and its links and emails are Google's.
What should a white-label ad report include?
It should answer five questions, in this order, before any branding is added:
- Did we spend what we planned? Spend against budget, with the pace.
- What did each platform report? Meta's and Google's own counts, each labelled with its attribution window.
- What did the business record? Orders and revenue from the shop, or won deals from the CRM, next to the platform counts. They count differently and never agree; say so once, plainly, and show them side by side.
- What is the one number we steer on? Blended ROAS (all revenue ÷ all ad spend), or cost per lead and cost per won deal for lead businesses.
- What changed, and what is next? Three lines, not three pages.
Does the agency need access to each client's ad accounts?
Yes, at least read access to every account the report draws on, and the cleanest way is the platforms' own agency structures rather than shared logins.
- Meta: the client shares its ad account with the agency as a partner from its business portfolio settings, using the agency's business portfolio ID. Meta lets the owner give full control or partial access limited to specific tasks, and only the owning business can share the asset onward.
- Google Ads: a manager account links client accounts under one sign-in, lets the agency compare performance across all of them and run reports over several at once, and lets it invite colleagues with different access levels. Google notes that one email address can be tied to at most 20 Google Ads accounts, which is why agencies with more clients use a manager account.
Set this up before the first report. When a client ends the contract, removing the partner or unlinking the account ends the agency's access cleanly, which is better for both sides than a password someone forgot to change.
Worked example: what manual reporting costs
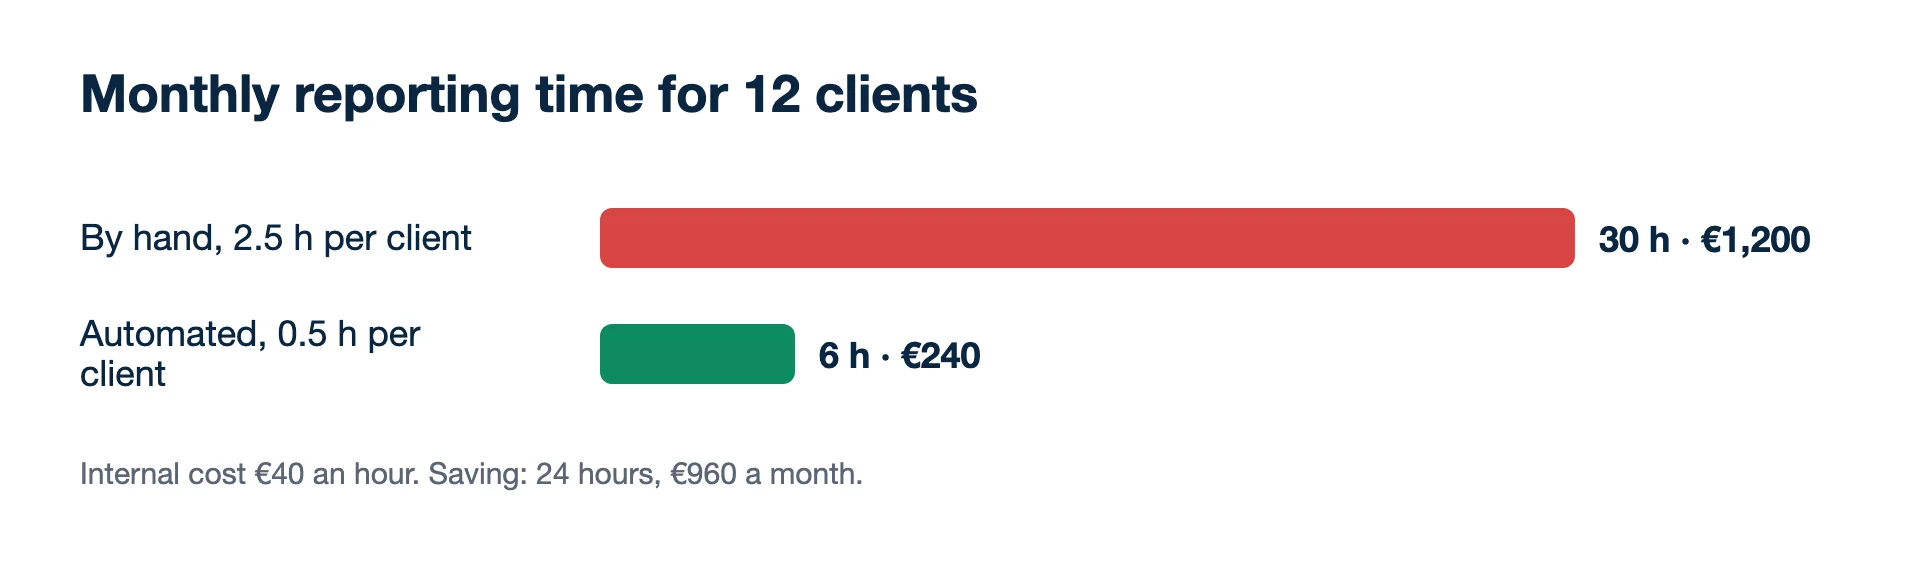
An agency with 12 clients builds monthly reports by hand: export from Meta and Google, paste into a template, add the shop's numbers, write the comments.
- Time per client: 2.5 hours a month
- Total: 12 × 2.5 = 30 hours a month
- At an internal cost of €40 an hour: 30 × €40 = €1,200 a month, or €14,400 a year
If an automated, branded report cuts that to 30 minutes per client for checking and writing comments, time falls to 12 × 0.5 = 6 hours (€240). The saving is 24 hours, or €960, a month.
When the tool does not pay on time saved alone
Run the same sums for a small agency with 3 clients: 3 × 2.5 = 7.5 hours (€300) by hand, 3 × 0.5 = 1.5 hours (€60) automated, a saving of €240 a month. For comparison, Kunads includes the client portal and white-label branding (logo, colours, domain) from its Growth plan at €299 a month ex VAT for up to 3 accounts, so at that size the hours alone do not cover it, and a branded Looker Studio report may be the sensible choice. The case changes with client count, with how much of the report is reconciling platform and shop numbers by hand, and with whether a live link replaces the "can you send me the numbers" emails.
Reports that look good and say little
- Branding before content. A polished report with 40 charts and no conclusion.
- Only platform numbers. Showing Meta's ROAS without the shop's revenue invites the question "then why is our bank account flat?".
- Mixed attribution windows across clients or months, so comparisons mean nothing.
- No comment. The client pays for judgement; the numbers alone are what the platforms already give them.
For what to write in the commentary itself, see how to report ad results to clients.
Related terms
- Google Ads Help: About Google Ads manager accounts (checked 2026-11-19)
- Meta Business Help Centre: Give a partner access to business assets in your business portfolio (checked 2026-11-19)
- Google Cloud documentation: Themes in Looker Studio (checked 2026-11-19)
- Kunads plan features and prices from kunads.ai pricing, 2026-11-19. Time and cost figures are an illustrative example.
Numbers from your shop, not from the ad platforms. Connect Meta, Google and Shopify, WooCommerce or Magento and see what each campaign kept.
Get my profit audit Open a free workspace