Is POAS better than ROAS?
Yes, POAS is better than ROAS whenever your products have different margins or you discount, because it judges each campaign on the profit its sales keep rather than the revenue. When margins are similar and steady, ROAS against one breakeven line gives the same answer and is easier to get.
What is the difference between POAS and ROAS?
ROAS divides revenue by ad spend; POAS divides the profit those sales keep by ad spend.
ROAS = revenue ÷ ad spend
POAS = profit from those sales ÷ ad spend, where profit = revenue − goods − payment fees − delivery − refunds (the contribution).
POAS of 1.00 is breakeven: the ads cost exactly what the sales kept. Above 1, the ads added profit. ROAS has no fixed breakeven; it is 1 ÷ margin, so it differs by shop and by product.
Worked example: two campaigns, same ROAS
| Campaign A (accessories) | Campaign B (electronics) | |
|---|---|---|
| Ad spend | €1,000 | €1,000 |
| Revenue | €4,000 | €4,000 |
| ROAS | 4.00× | 4.00× |
| Margin | 60% | 18% |
| Profit from sales | €2,400 | €720 |
| POAS | 2.40 | 0.72 |
| Profit after ads | €1,400 | −€280 |
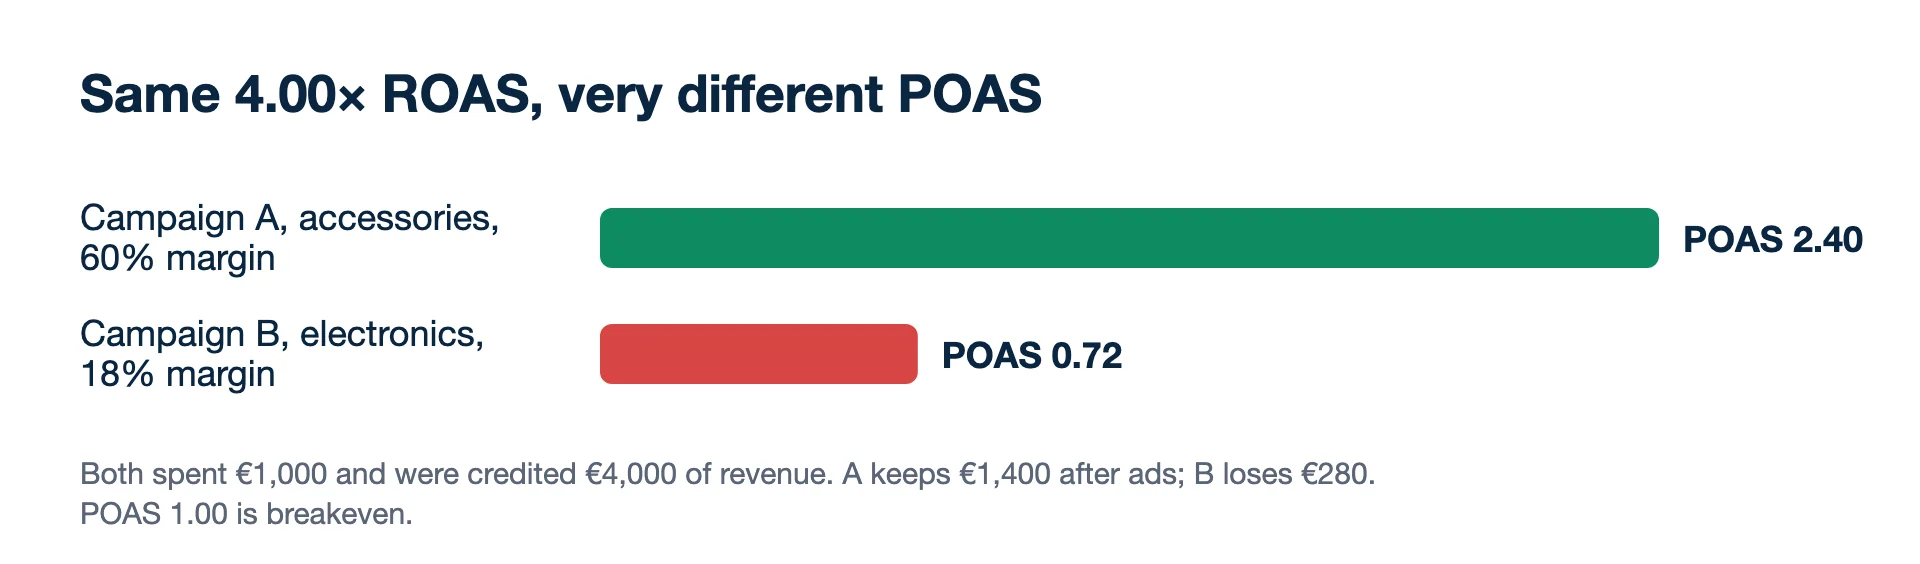
ROAS says the two are equal. POAS says A makes €1,400 and B loses €280. With ROAS alone, you would need a separate breakeven for each (1.67× for A, 5.56× for B) to see the same thing. Try your figures in the POAS calculator.
Example two: a discount that lifts ROAS and cuts profit
A product sells at €100, costs €60 to buy, fulfil and deliver, and keeps €40. A campaign spends €1,000 and sells 30: revenue €3,000, ROAS 3.00×, profit from sales €1,200, POAS 1.20. Then a 25% sale starts. The price is €75, costs are still €60, so each sale keeps €15. The same €1,000 now sells 50: revenue €3,750 and ROAS 3.75×, the best week on the dashboard. Profit from sales is 50 × €15 = €750, so POAS is 0.75 and the campaign loses €250 after ads. ROAS rose by a quarter while the campaign went from €200 profit to a €250 loss. Only a margin-aware number catches that in the week it happens.
When is ROAS good enough?
ROAS is good enough when every product keeps about the same share of its price, because then one breakeven ROAS (1 ÷ margin) says what POAS would.
- One product, or products with margins within a few points of each other.
- You do not have per-product costs yet. A shop-wide breakeven ROAS is far better than nothing.
- Quick comparisons inside one platform, on one attribution setting.
Where POAS earns its keep
- Mixed catalogues where margins range widely, as in the example.
- Heavy discounting: POAS falls the moment a discount eats the margin; ROAS may even rise.
- Shopping and Performance Max campaigns, which push whatever sells, often the cheapest and lowest-margin items.
- Reporting to owners who think in profit.
How to start using POAS
- Get cost of goods per product (or per category) into one sheet, plus your average payment fee, delivery cost and refund rate.
- For each campaign, split the revenue it was credited with by product group and apply each group's margin.
- Divide the profit by the campaign's spend. Below 1 is a loss; review those first.
- Once the numbers are trusted, consider sending profit as the conversion value so bidding chases it too.
The limits of POAS
- It needs cost data. Cost of goods per product, fees, delivery and refunds. Wrong costs give a confident wrong number.
- It still depends on attribution. A campaign's POAS uses the sales the platform credits to it, so it inherits the same counting rules as ROAS. For the whole account, use profit after ads from the shop: all contribution − all ad spend.
- It ignores repeat purchases unless you add them. A first order at POAS 0.9 can be fine if the customer reliably buys again; see LTV.
- Platforms optimise for what you send. To make bidding chase profit, the conversion value itself must carry profit; Google's value-based bidding and Meta's value optimisation both work on whatever value you pass. Read more in POAS vs ROAS.
What the platforms show you
Neither platform reports POAS by default; both report revenue-based ROAS from the conversion value they receive. Google comes closest: with conversions with cart data, Google Ads combines the items in each purchase with the cost of goods from your Merchant Center feed and reports gross profit. That covers goods only, not fees, delivery or refunds, so treat it as an upper bound on contribution. In Meta's reports, profit shows up only if you send profit as the conversion value.
Kunads shows real profit and POAS per campaign (revenue × measured margin − ad spend) next to ROAS, and can send profit back to Meta and Google as a separate conversion, opt-in per account.
- Example figures: illustrative.
- Google Ads Help: About conversions with cart data (gross profit from Merchant Center COGS) (checked 2026-11-19)
- Google Ads Help: About conversion values (checked 2026-11-19)
- Meta for Developers: Conversions API, value optimisation (checked 2026-11-19)
See it on your own campaigns. Kunads reads your Meta and Google ads and your shop's orders, read-only, and shows the result per campaign.
Run the free profit audit Start a 14-day trialPOAS questions before you switch
Is POAS the same as net profit?
No. It usually uses contribution (after goods, fees, delivery, refunds), not net profit after rent and salaries. Fixed costs still have to be paid from the total.
Should POAS and ROAS sit in the same report?
Yes, side by side. ROAS shows what the platform credits in revenue, POAS what that revenue keeps. A gap between their rankings is where the margin story is.